SharePoint sprawl can keep you awake at night, right? 😩 The challenge of tracking hundreds or even thousands of sites leaves you overwhelmed by rising storage costs and complex governance. It becomes nearly impossible to recall every detail when unused sites are scattered throughout your environment.
The solution? Having a complete view of your SharePoint ecosystem makes managing resources and security much easier! 💯
However, relying on one method may offer simplicity but could miss important details. 👎 But don’t worry! There are several proven methods that help you generate SharePoint Online site usage reports. Let’s jump into the blog and learn how you can get site usage reports to regain control over your SPO sites and optimize resource allocation.
Why are SharePoint Online Site Usage Reports Necessary?
SharePoint Online usage reports transform complex data into clear, actionable insights that help administrators excel at management, optimization, and security tasks. Let’s explore why SPO site usage reports are essential for modern SharePoint environments.
Find How Users are Engaging in the SharePoint Sites
Understand how users interact with content and spot emerging usage trends effortlessly with site usage reports. These include unique viewer counts, visit frequencies, and page engagement duration. Such visibility provides the data you need to optimize your content strategy effectively.
Check What’s Taking Up Storage on SharePoint Sites
Managing SharePoint storage efficiently is crucial for maintaining site performance. These reports help track your site storage quota, enabling administrators to make smart capacity management decisions. Understanding which content consumes the most space allows for targeted cleanup efforts and optimization. This insight proves particularly valuable when planning archiving for SharePoint to accommodate future growth needs.
Identify Who’s Sharing SharePoint Sites’ Content Externally
Comprehensive reporting sheds light on external sharing activities in your SharePoint sites. By monitoring who shares content externally, what’s being shared, and recipient access patterns, you can proactively detect potential security concerns. This visibility strengthens your ability to manage sharing and access in SharePoint Online effectively while maintaining appropriate collaboration boundaries.
Enhance SharePoint Efficiency with Site Usage Analysis
Unlock comprehensive insights into your SharePoint Online environment by monitoring:
- File Collaboration Patterns:
- Co-authoring sessions
- Version history tracking
- Edit trends to spot workflow bottlenecks
- User Access Analysis:
- Monitor access across various devices and platforms
- Optimize site design based on usage patterns
- Feature Adoption Tracking:
- Identify the most valuable site components
- Determine which features require promotion or retirement
Efficient Methods for Tracking SharePoint Online Site Usage
Managing sites is like playing a high-stakes game—every move counts! 🏆 To stay ahead, you must monitor all SharePoint Online site activity across your organization. However, navigating through raw data can be overwhelming. Instead, you can generate a SharePoint Online site usage reports that covers all the critical aspects of your environment. 💡 These built-in site usage reports offer comprehensive insights, tackle various management challenges, and help you to optimize overall SharePoint Storage size.
- SPO site usage report from Microsoft 365 admin center
- SharePoint site usage report using Microsoft Graph PowerShell
- Site usage analytics in SharePoint sites
- Microsoft 365 unified audit log for site activities
- SharePoint site usage from the Power BI usage analytics app
Export SharePoint Site Usage Report in Microsoft 365 Admin Center
Accessing and exporting SharePoint Online site usage data is straightforward via the Microsoft 365 Admin Center. Here’s how to retrieve comprehensive usage and activity reports for all SharePoint sites.
- Log in to the Microsoft 365 admin center and navigate to Reports → Usage.
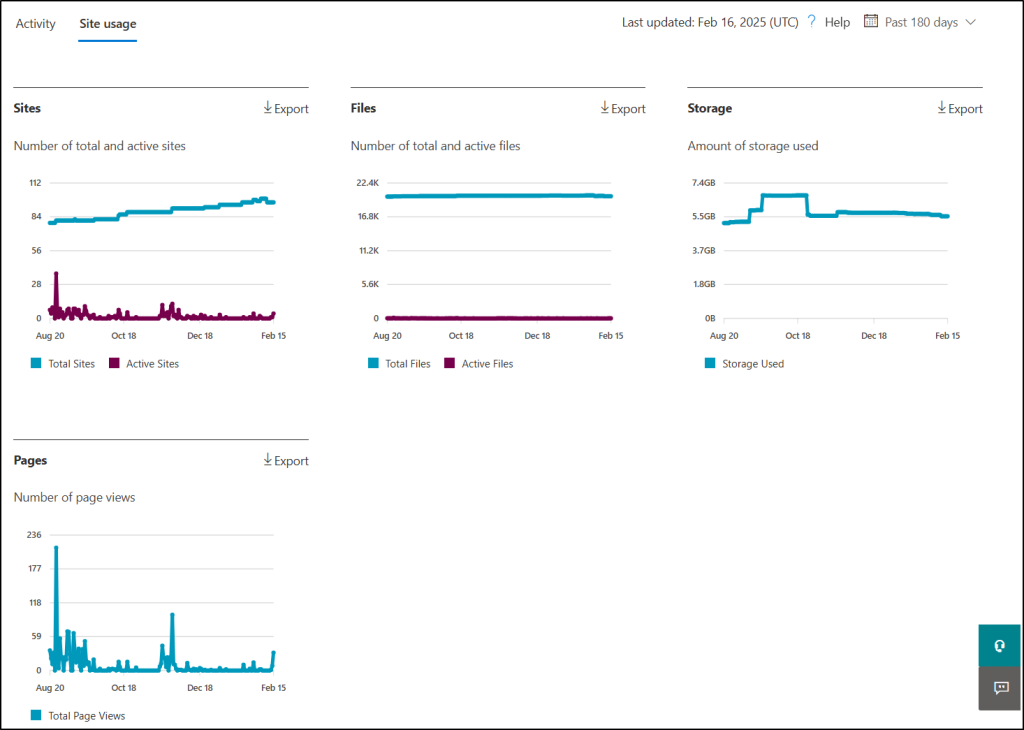
- Under Reports, select SharePoint and then switch to the Site usage tab. This report will show the sites’ activity trends and their last activity date in SharePoint Online.
- It organizes details like total unique files, active files, used storage, and total page views. This report is available for the last 7 days, 30 days, 90 days, and 180 days.
- You can also add the additional information columns using the Choose columns option. Use the Export option to download site usage details as a CSV file.
Automate Custom SPO Site Usage Report with Microsoft Graph PowerShell
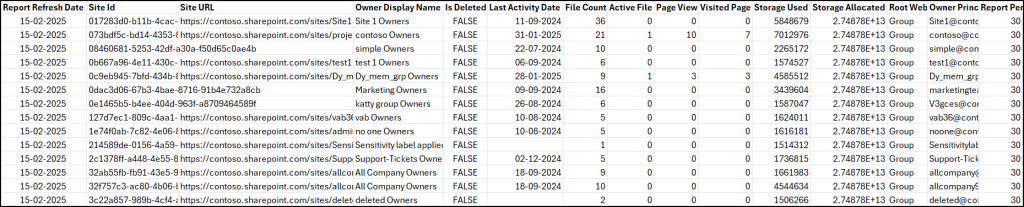
A common challenge with the M365 admin center’s SharePoint usage report is that it omits the actual site URLs, making it difficult to quickly locate and manage active sites. To overcome this limitation, we’ve developed a PowerShell script that not only retrieves detailed SharePoint usage information but also enriches the report by including the URL for each site.
|
1 2 3 4 5 6 7 8 9 10 11 12 13 14 15 16 17 18 19 20 21 |
#Replace <FilePath> with the file location you want to save $File = "<FilePath>" #Replace <Days> with the specific period of time. (i.e., D7, D30, D90, D180) $Time_Period = '<Days>' Connect-MgGraph -Scopes "Reports.Read.All","Sites.Read.All" Get-MgReportSharePointSiteUsageDetail -Period $Time_Period -OutFile $File $SiteUsageReport = Import-Csv -Path $File foreach ($SiteRecord in $SiteUsageReport) { $SiteId = $SiteRecord.'Site Id' if ($SiteId) { $SiteDetails = Get-MgSite -SiteId $SiteId -ErrorAction SilentlyContinue $SiteUrl = $SiteDetails.WebUrl $SiteRecord.'Site URL' = $SiteUrl } else { $SiteRecord.'Site URL' = "No Site ID provided" } } $SiteUsageReport | Export-Csv -Path $File -NoTypeInformation |
As the Microsoft Graph PowerShell module is still in migration and expansion for services like SharePoint, Exchange, Outlook, etc., not all functionalities are currently available through the MS Graph module. Therefore, this script only retrieves site URLs of the active SharePoint sites.
Monitor Real-Time Site Usage Analytics within SharePoint Sites
The site usage analytics available on every SharePoint Online site help you to analyze the site usage and activities. It is considered the easiest way for site owners and a time-consuming method for admins to check site usage details.
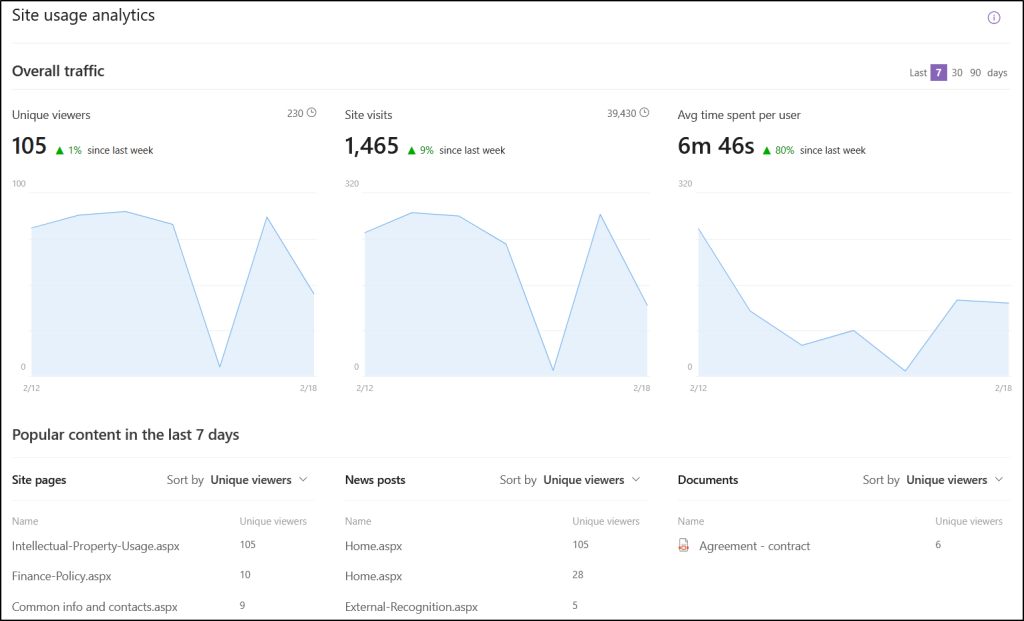
To view SharePoint site usage analytics, log in to the desired SharePoint Online site and navigate to Settings → Site usage. This will give you access to a variety of insightful metrics of the site. For instance, you can check
- Overall site traffic such as unique viewers, site visits, time spent per user
- Identify popular content like site pages, posts, and documents within the selected period of time.
- Track files or folders shared and being accessed by users outside your organization.
Additionally, it offers a detailed report on documents and folders shared externally. This is incredibly valuable for site owners aiming to keep tabs on external sharing activity.
Audit User Activities in SharePoint Online Using Microsoft Purview
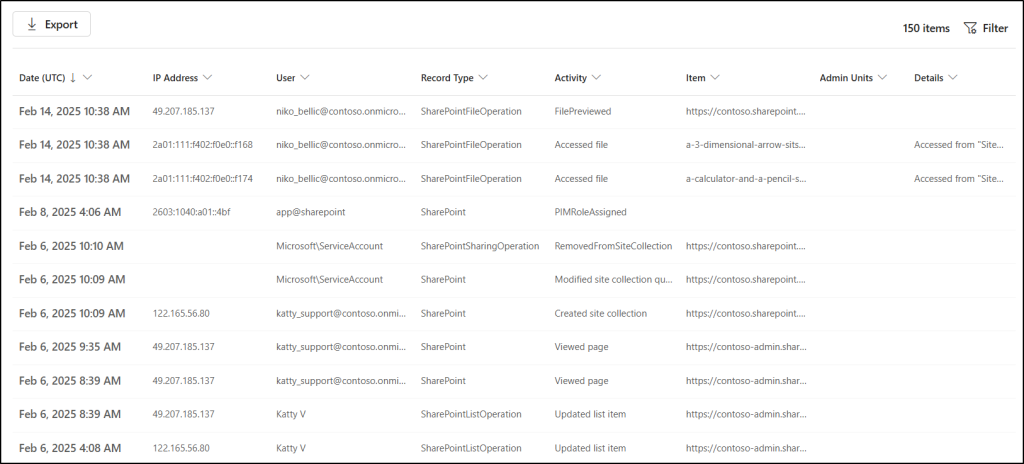
The most thorough reporting in Microsoft 365 comes from the audit search in the Microsoft Purview portal. It is an unified audit log for the Microsoft 365 environment. Whether it is a single site or all sites in your SharePoint Online, it provides granular details into the site usage. Let’s see how we can get a usage report for all SharePoint Online sites using audit search.
- Navigate to the Audit section in the Microsoft Purview portal and customize the start & end date as per your requirement.
- In the Workloads field, select SharePoint and name your search in the Search Name field to uniquely identify it among other searches.
- In the Activities – friendly names field, select the activities related to SharePoint site usage, like
- Page views
- Sign-in events
- Document interactions
- Search activities
- Sharing events
- Collaborative actions
- These are just a few examples from a wide range of available activity metrics that provide a comprehensive view of how users interact with your SharePoint sites.
- Finally, click Search and wait for the search to complete. Once finished, you can view and export the usage report for all SharePoint Online sites to CSV.
You can also filter the specific user, site, file, folder, and even operation while doing an audit search in the Purview portal.
Visualize SharePoint Usage in Power BI
The Microsoft 365 usage analytics app in Power BI fuses M365 usage reports with Power BI’s interactive tools to visualize valuable usage and adoption insights. With this data, you can tailor training and communication strategies that modernize how your organization collaborates.
Enable Microsoft 365 Usage Analytics
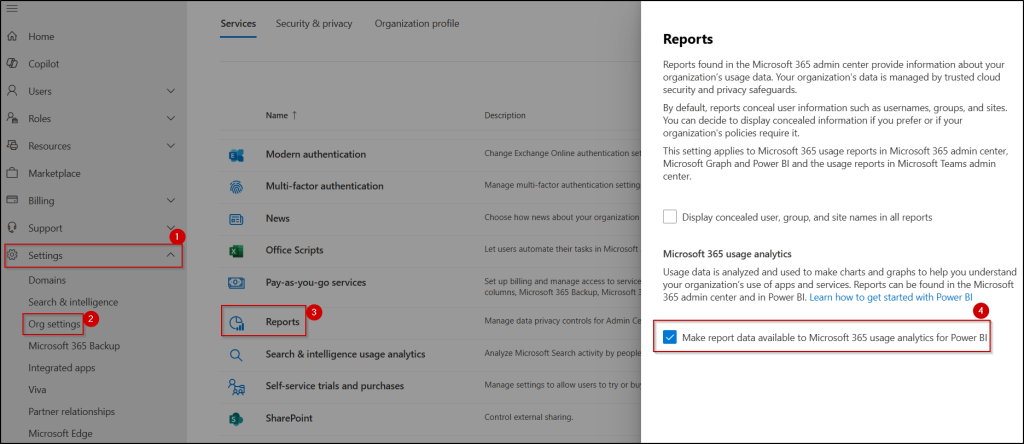
To view the SharePoint Usage analytics in the Power BI, you first need to enable Microsoft 365 usage analytics.
- In order to achieve that, login to the Microsoft 365 admin center and navigate to the Settings → Org settings.
- Under Services tab, select Reports and enable the checkbox under the Microsoft 365 usage analytics.
Set Up Microsoft 365 Usage Analytics App
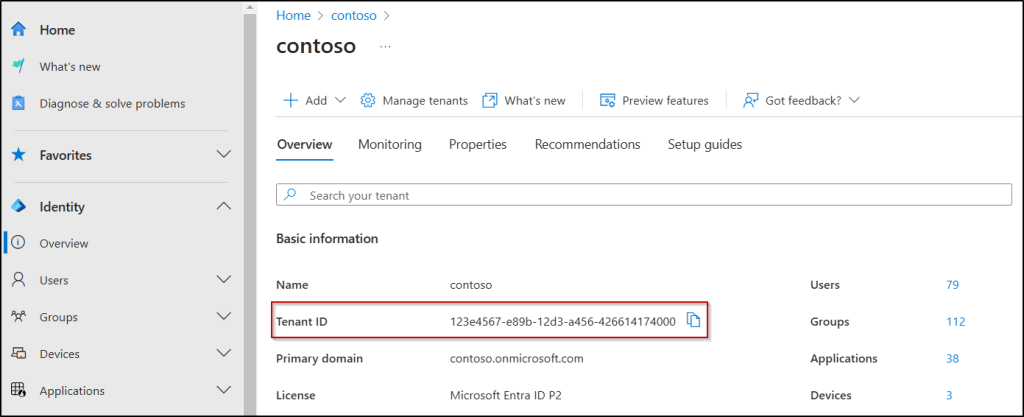
First, you need your tenant ID to set up usage analytics app in the Power BI. You can copy this from the overview page of the Microsoft Entra admin center.
- Next, sign in to the Power BI and go to Apps, then click Get apps. Under All apps tab, search and choose the ‘Microsoft 365 Usage Analytics’ app. Click the Get it now.
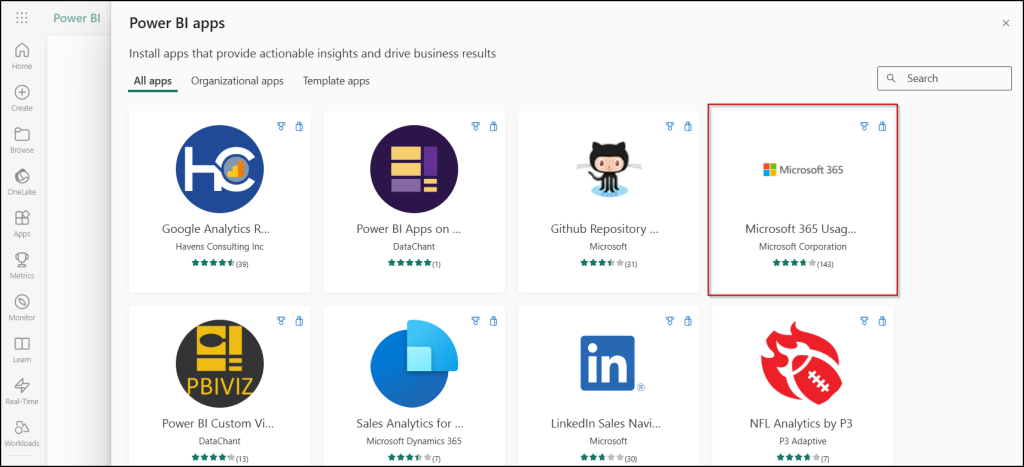
- Click the Connect your data link in the warning bar that reads “You’re viewing this app with sample data”, then enter the tenant ID you previously copied from the Entra admin center.
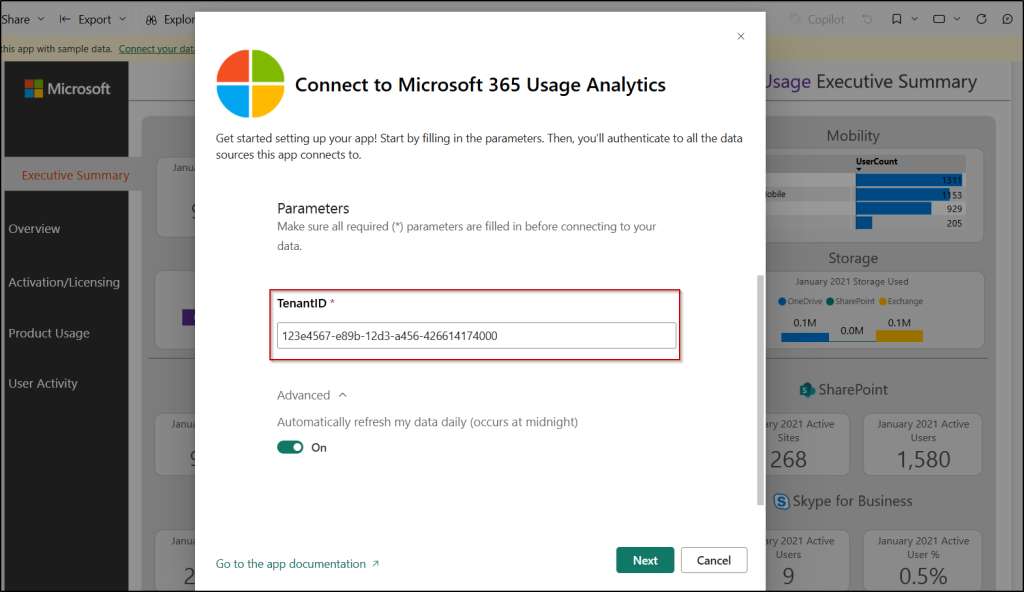
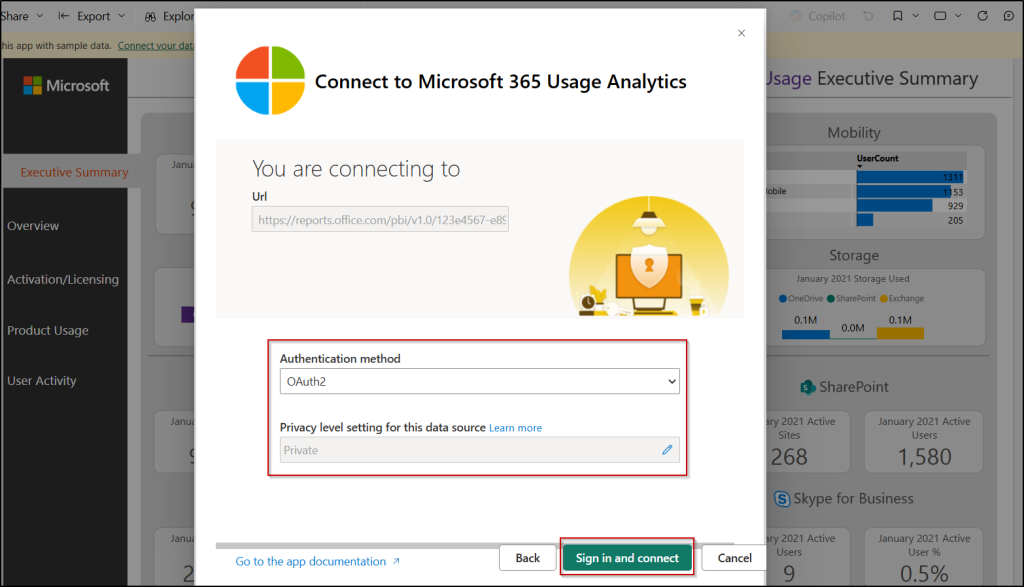
- Keep the Authentication method as OAuth2 and ‘Sign in and connect’. Finally, authenticate with your credentials.
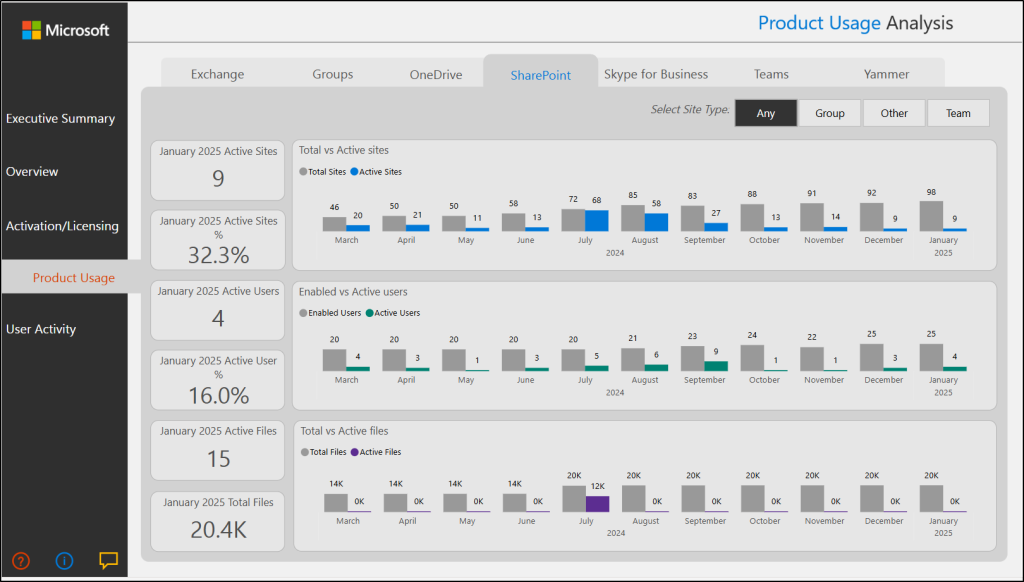
Now, usage data is collected, analyzed and turned into charts and graphs to help you understand how your organization uses apps and services.
To view SharePoint usage analysis, go to Product Usage → SharePoint tab. It will show usage summary of sites, users, and files in your SharePoint Online.
📝Tip: You can export site usage reports from the Microsoft 365 admin center and visualize them in Power BI to gain interactive insights into your site’s usage trends.
To sum up, SharePoint Online usage site reports offer you essential insights into collaboration and engagement across your organization’s SharePoint ecosystem. By applying the methods outlined above, you can easily monitor and understand your SharePoint Online activity.
Hope this blog has enhanced your understanding of Microsoft 365 SharePoint usage site reports. If you have any questions or require additional help, please feel free to leave a comment below.


