On Day 15 of Cybersecurity Awareness month, let’s learn to track Microsoft 365 secure score changes for improved security. Stay tuned for upcoming blogs in Microsoft 365 cybersecurity blog series.
Finally, we came to an end to our 15-day Microsoft Secure Score recommendations. Over the past 14 days, you’ve likely learned how to boost your identity security, manage third-party apps security, and more. If you’ve already configured some of those recommendations, give yourself a pat on the back! But guess what? You’re only halfway there! Even though you’ve implemented some Secure Score recommendations, it’s equally important to monitor your Secure Score consistently. Let’s see why.
Why is it Important to Monitor Microsoft 365 Secure Score Changes?
Imagine you’ve marked a recommendation as “Planned,” but one of your co-admins accidentally marked it as “Risk accepted.” What happens? You could miss out on executing that important recommendation because it’s no longer on your radar. By regularly reviewing the Secure Score reports, trends, and metrics, you can prevent this!
To assist you, Microsoft provides a Secure Score Overview page where you can analyze frequent score changes, top recommendations, and more. For a deeper dive, Microsoft offers two dedicated dashboards to help you monitor Secure Score changes effectively. Let’s see them!
A. Track your Microsoft Secure Score history
B. View Microsoft Secure Score trends and metrics
A. Track your Microsoft Secure Score History in Defender
Tracking Secure Score history helps admins identify trends, prioritize actions, and ensure continuous security improvements. To view your organization’s Secure Score history, follow this path:
Microsoft 365 Defender > Exposure management > Secure score > ‘History’
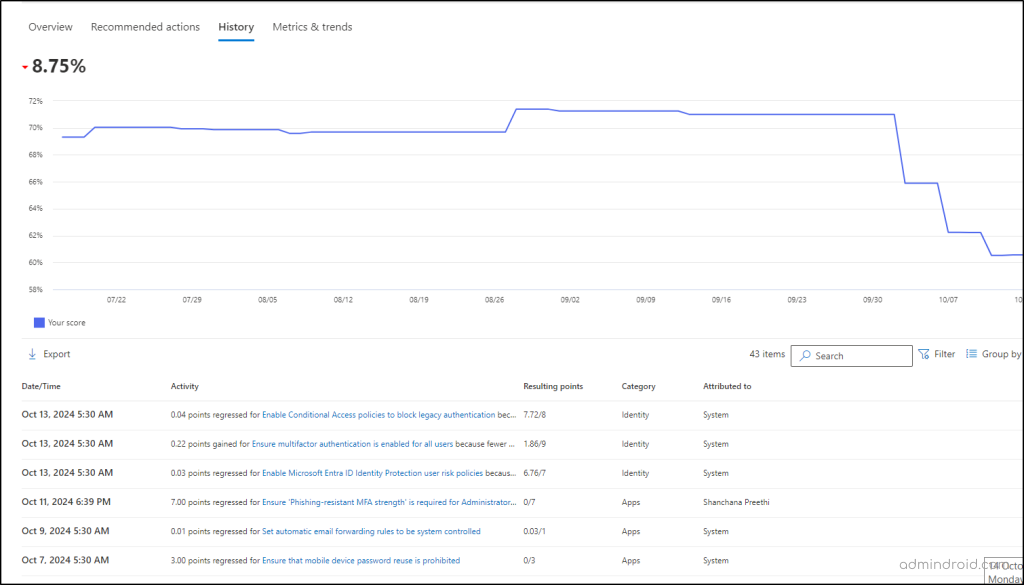
Here’s the breakdown of the ‘History’ tab.
- Visualize Security Trends
The History tab offers a weekly graph of your Secure Score by default, showing changes over time. This makes it easy to spot vulnerabilities and take immediate action. By default, it shows secure score changes for the past 90 days. However, you can customize them based on your requirements.
- Analyze Actions Taken
Below the graph, the Secure Score report lists all actions taken, including points gained/ regressed and categories. You can filter by date, category, & group data to focus on key areas and to export them if needed.
- Dive Into Action Details
Click on any action in the table to see more details in a flyout pane, including how it impacted your Secure Score and the changes it brought.
- Review Action History
The ‘History’ tab in the pane shows how a specific action evolved over time, allowing admins to track the effectiveness of their security measures.
B. Analyze Microsoft Secure Score Trends and Metrics
To view your organization’s Secure Score metrics and trends, follow this path:
Microsoft 365 Defender > Exposure Management > Secure Score > Metrics & Trends
In this tab, you’ll find various graphs and charts that provide deeper insights into security trends and help you set goals. By default, the trends will be shown for You can adjust the date range to apply across all the visualizations. These visualizations include:
1. View Your Secure Score in Microsoft 365 Defender
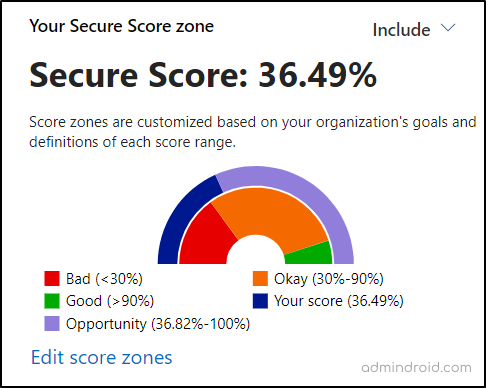
The “Your Secure Score Zone” card displays your organization’s current Secure Score, providing an overview of your security posture. You can customize this card to include additional details for deeper insights. Let’s explore them!
Configure Good and Bad Secure Score Ranges
You can define ranges for good and bad scores based on your internal security goals. This helps you quickly understand where your score stands in relation to these targets. Additionally, the card highlights areas of improvement, showing how much progress can be made to achieve a higher Secure Score. Here’s how to set it up:
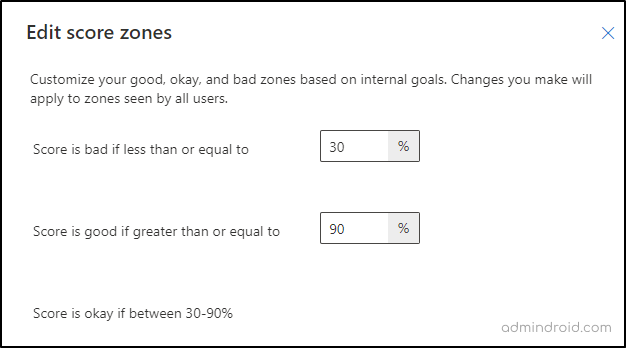
- Click “Add score zones”.
- Specify your thresholds:
I) “Score is bad if less than or equal to” a certain percentage.
II) “Score is good if greater than or equal to” your required percentage.
III) Based on this, “Score is okay if between” will be automatically configured.
- Once done, a pie chart will be included with the specified percentages.
Customize Secure Score Insights in Microsoft 365 Defender
You can get a clear view of your planned, achievable, and current progress using this card. Follow these steps to customize it:
- Navigate to the “Include” dropdown.
- Select the elements you want to add:
- Planned score: This shows the score you will achieve once your planned and recommended actions are completed.
- Current license score: This reflects the score you can achieve with your current license.
- Achievable score: This indicates the maximum possible score your organization can achieve based on your current Microsoft 365 licenses and risk acceptance.
Once done, the pie chart (visualization) will include the specified options and show the respective percentages.
2. Compare Microsoft Secure Score with Other Organizations
Microsoft allows you to benchmark your Secure Score against organizations of similar size using this card. This comparison provides insights into whether your security measures align with industry standards and Microsoft 365 best practices. It’s useful for identifying gaps in your security posture and ensuring you’re keeping pace with others in your sector.
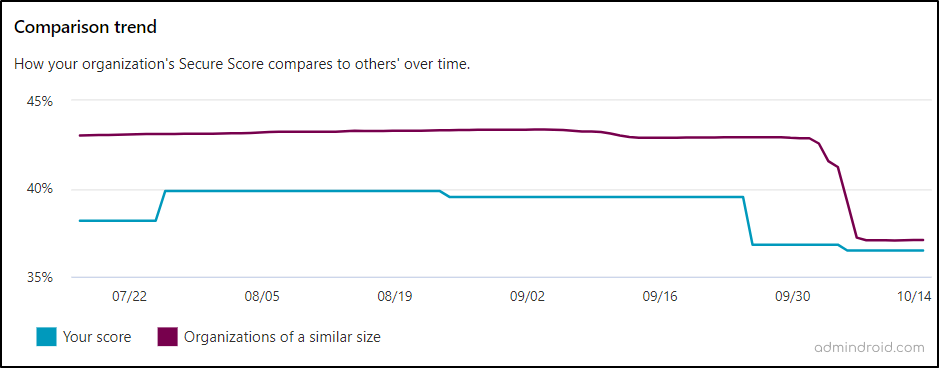
This Secure Score comparison trend is completely anonymous, meaning you won’t know the specific organizations you’re being compared with, ensuring privacy while still providing valuable context.
3. Track your Microsoft Score Changes Overtime
Using this card, you can track the percentage of points gained or lost over the past 90 days by default. A detailed breakdown of ‘Points Achieved’ and ‘Points Regressed’ can be easily identified, helping you understand your security progress.
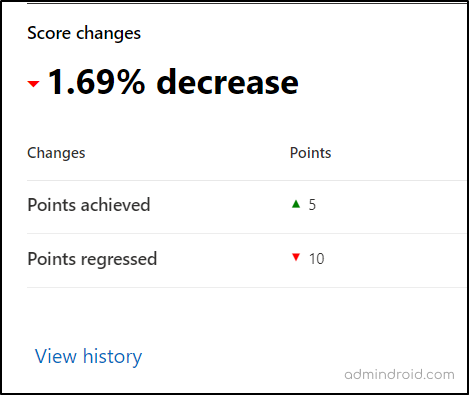
You can make use of the ‘View History’ link to dig deeper into these changes. It takes you to the history tab, where you can pinpoint which specific recommendations were responsible for score changes.
4. Regressed Score Trend Analysis in Microsoft 365 Defender
A regressed score refers to the points that decrease due to changes in users, devices, or other factors. For example, let’s say you’ve implemented a recommendation that needs to be applied to all users, and you’ve done that. Later, you add new users to your organization, but those users aren’t covered by the recommendation. As a result, the recommendation will be marked as incomplete, causing a decrease in your score.
To track these changes, the “Regression trend” card is very helpful. You can view a timeline showing how your points have regressed due to changes in configurations, users, or devices.
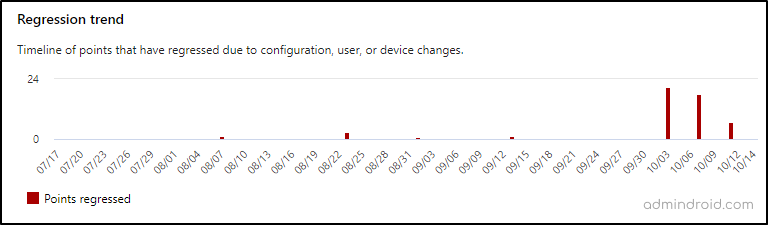
Clicking the “View current regressed actions” link on this card will show you the specific actions that have caused your score to regress. Added to that, you can click the “View related history” link, which will bring you again to the ‘History” tab and helps you find the recommendation responsible for this regression.
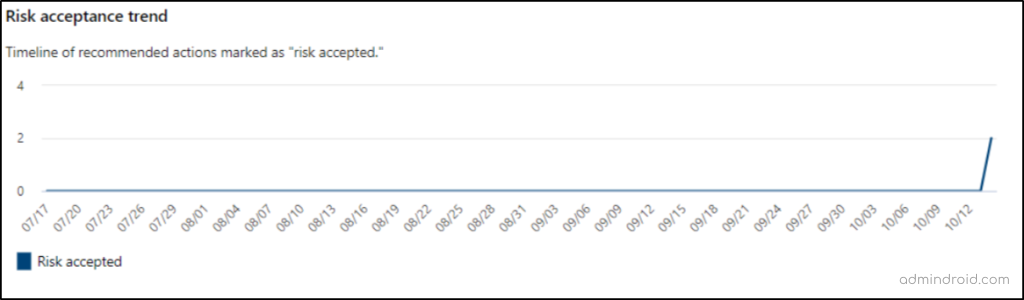
5. View Microsoft Secure Score Risk Acceptance Trend
Sometimes, the Microsoft Secure Score recommendations may not align with your organization’s compliance or security needs. In such cases, you can mark them as “Risk acceptance,” meaning you’re willing to accept the risks of not implementing the recommendation.
The “Risk acceptance trend” card allows you to view all the accepted risks over the last 90 days. By clicking the “View current risk accepted actions” link, you can see the recommendations marked as “Risk accepted” recently.
That’s it. I hope this blog brings you efficient information on how to track Secure Score changes effectively. If you have any queries, kindly leave them in the comment section.


