“Conditional Access Policies in Entra ID” – In the rising tide of cyberattacks, having these policies in Microsoft 365 is crucial. If you’ve already configured Conditional Access policies in your tenant, pat yourself on the back! Great job! 🙌 But what’s next? After implementing these policies, it’s crucial to monitor their effectiveness in your tenant. This involves checking whether they positively affect Microsoft 365 user sign-ins or cause issues. 💯
To analyze the effect of Conditional Access policies in your organization, Microsoft provides a “Conditional Access insights and reporting workbook” in Entra ID. Let’s explore it further after we learn about the Entra Workbook. 👇
What are Workbooks in Entra ID?
Workbooks in Entra ID give you personalized, interactive dashboards to monitor Entra ID sign-in and audit logs. These workbooks help you analyze your Entra data by providing visually engaging and comprehensive reports.
The Entra workbook feature includes many ready-to-use templates to help you get started easily. Here are a few examples:
- Authentication prompt analysis workbook
- Sign-in failure analysis workbook
- Conditional Access gap analyzer workbook
- Multifactor authentication gaps workbook
- Sign-in analysis workbook
- Risk-based Conditional Access policies workbook
One such template we need is the “Conditional Access insights and reporting workbook.” Let’s dive into it now.
Conditional Access Insights and Reporting Workbook
The Conditional Access insights and reporting workbook helps you evaluate the impacts of configured Conditional Access policies. It provides detailed Entra ID sign-in logs and highlights users who are bypassing the configured CA policies.
Benefits of Conditional Access Workbook
✅During sign-ins, multiple Conditional Access policies may be applied based on various configured conditions. So, the workbook helps you with a granular investigation by allowing you to check the enforcement statistics of specific or a set of policies. It’s helpful for you especially to monitor the Conditional Access policies in report-only mode.
✅Not just an overview, this workbook gives you in-depth details of all Conditional Access conditions like device platform, apps, and device. So, you can easily analyze the failure or not applied CA policy reasons and fill the Conditional Access gaps.
How to Use Conditional Access Insights and Reporting Workbook?
To access this workbook, follow the steps below.
- Sign in to the Microsoft Entra admin center.
- Navigate to the “Monitoring & health” section and select the “Workbooks” option.
- Now, select the “Conditional Access Insights and Reporting” workbook under the Conditional access section.
Note: You can access this workbook under Protection → Conditional Access → Insights and reporting of Entra ID.
Once done, you can see two sections.
Let’s explore them in detail one by one! But before that make sure you meet the following prerequisites.
✅ To view the user sign-ins section, you should configure the diagnostic setting to send SignInLogs to your Log Analytics workspace.
✅ To view service principal sign-ins, you should configure the diagnostic setting to send ServicePrincipalSignInLogs to your log analytics workspace.
📣Audit Conditional Access Effects on User Sign-ins
In the “User sign-ins ” section, you can gain complete insights into the user’s sign-ins. i.e.) Users who interact with Microsoft Entra ID to access resources.
This section contains four subsections, all of which heavily depend on the filters provided at the top. Understanding these filters is essential before diving into the detailed subsections. Let’s see the available filters and then proceed with the rest of the sections.

- Conditional Access policy: As said earlier, you can view the impact of combined/individual CA policies with this workbook. This filter helps to do it. It is divided into two groups: enabled and report-only policies. You can select the policies based on your requirements. By default, it is set to provide insights on all enabled policies.
- Time range: You can easily analyze the impact of a CA policy over a specific time with this filter. By default, it is set to 24 hrs. You can select the range from 4 hrs to 90 days. If not, you can also customize the time range.
- User: To analyze the impact on individual users, you can use it wisely. By default, it points to “All users”. To check on specific users, type the user’s name in the text field.
- App: To check the policy enforcement based on apps, you can use this filter. By default, it is set to “All apps”. To check for individual apps, type the name of the app into the text field.
- Data view: You can use this filter to choose whether the dashboard displays results based on the number of affected users or the number of impacted sign-ins.
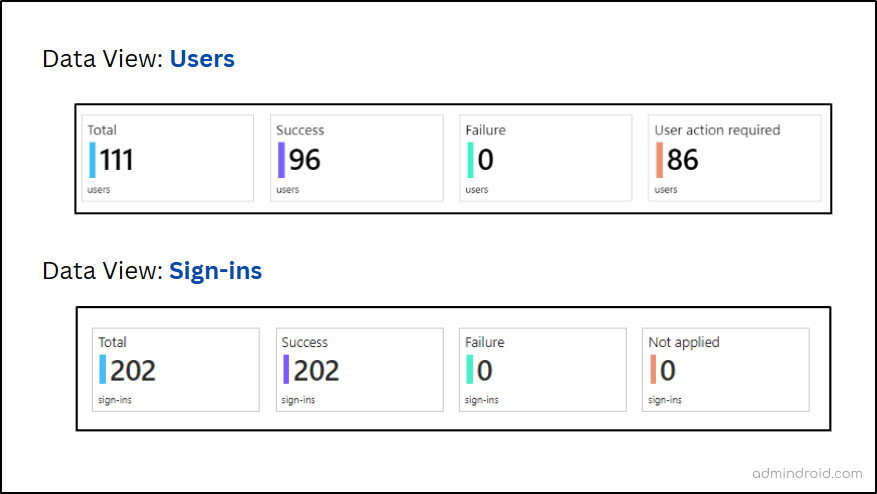
Note: If you select the data view to be users, a user could be included in both the success and failure counts.
Let’s enter into three sections now!
1. Summary of Conditional Access Policy Impacts on User Sign-ins
After selecting Conditional Access policies, the “Impact summary” section will be populated. This summary tells you how many users/sign-ins were affected by these policies. It basically breaks down the results of the applied policies.
Note: I have explained the tiles below by setting the “Data view” parameter to “Users”. But, as previously said, you can also set it to “Sign-ins” if necessary.
- Total: This shows you the overall number of users where at least one of the chosen policies comes into play. It’s like a big-picture view.
- Success: Here, you’ll find the number of users that smoothly passed through all the Conditional Access policy conditions. It’s the green light.
- Failure: This tile tells you how many users failed to meet the conditions set by the policies and were denied access. Red light situation.
- User Action Required (only for report-only policies): It shows the number of users where a selected report-only policy was applied. But if that policy were enabled, the user would need to take some action to access it.
- Not applied: Here you can get the count of users that bypassed selected Conditional Access policies as the sign-in didn’t match any of the conditions.
2. Analyze Sign-ins Based on Conditional Access Conditions
Here, you can view the breakdown of sign-ins for all Conditional Access policies and conditions based on the summary tile above you choose.
Let’s take you have clicked the failure tile from the summary section. The below six Conditional Access conditions will help you find the reason for the failure.
- Device State:
Provides a pie chart showing the state of the devices (e.g., managed, trusted) used by users who experienced failed sign-ins.
- Device Platform:
Shows the count of each platform (e.g., Windows, macOS, iOS) used by users whose sign-in attempts failed due to CA policy.
- Client App:
Details the software or apps (e.g., browsers, mobile apps, desktop clients) that the users were using when their sign-in attempts failed.
- Sign-in Risk:
Displays the risk level associated with the sign-in attempts that failed, helping to identify potential security threats.
- Location:
Indicates the geographic locations of failed sign-in attempts blocked by Conditional Access policies in Entra ID.
- Applications:
Gives insights into the specific applications that users were trying to access when they failed to meet the Conditional Access policy requirements.
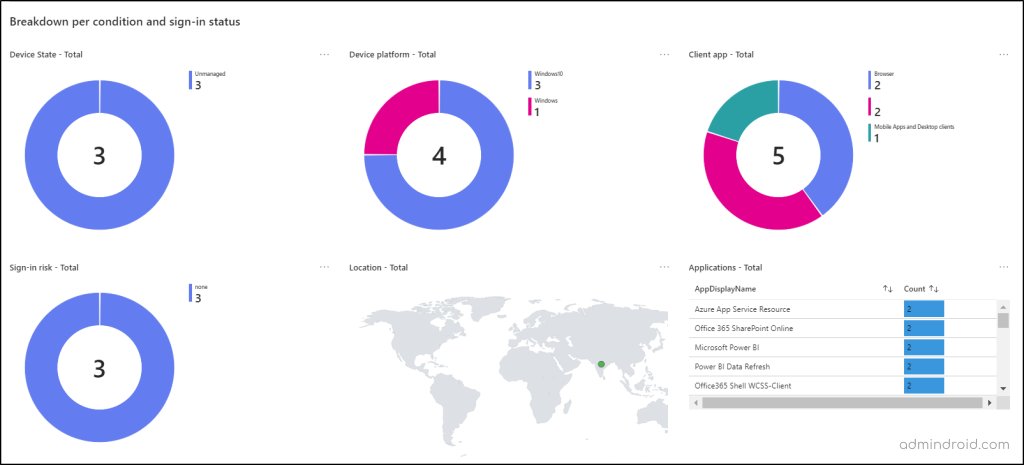
By gaining these insights, you can understand why users failed to meet the Conditional Access policies.
Real-time Use Case Explanation:
For example, consider you have a policy that only allows users from the USA. Now, click the failure count tile and go to the location condition.
Here, you can see where the failed users are located. If they are outside the USA, this could be why they were denied access!
- This kind of insight helps you further investigate such risky users/sign-ins and protect the organization from data leakages.
I have explained this just for failure cases, same as this, you can also even check the positive impact of the policy by clicking the success tile in the summary section.
3. Investigate Microsoft 365 Sign-ins Impacted by Conditional Access
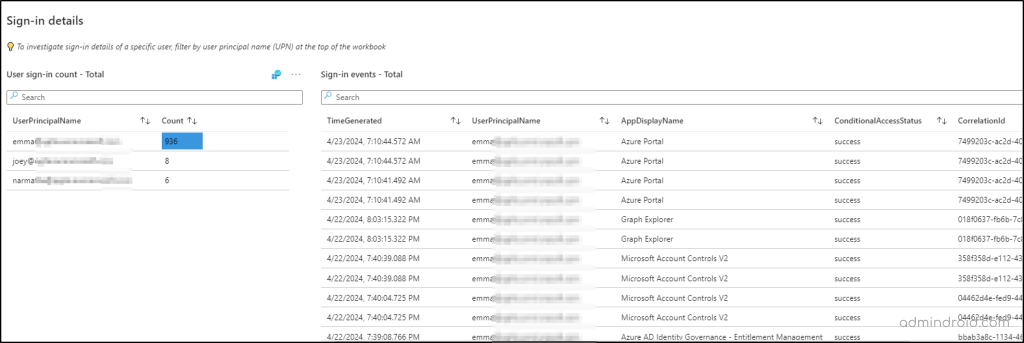
This “Sign-in details” section gives you two sub-sections to help you analyze the users’ sign-ins in depth.
User Sign-in Count: This part auto-populates with user data based on the sign-in status tile you selected in the summary section.
- For instance, if you click on the “Success” tile, this sub-section will list all the users and their sign-in counts who successfully passed the selected Conditional Access policies.
- Similarly, if you select the “Failure” tile, you’ll see detailed information about users and their sign-in attempts that were denied access for not meeting the conditions.
Note: You can also investigate the sign-in details of a specific user. To do it, you need to type the respective username in the “User” filter.
Sign-in Events: Once you select a specific user or sign-in status in the above section, this part automatically displays detailed information, such as sign-in time, application ID, Conditional Access status, and more. This helps you get an in-depth understanding of each sign-in event.
📣Analyze Conditional Access Impacts on Service Principal Sign-ins
Previously, Conditional Access policies were applied only to users for accessing Microsoft 365 resources or apps. A few months back, Microsoft extended support to apply Conditional Access policies to service principals too.
- This Conditional Access policy for workload identities will help you prevent attacks by compromised service principals. For example, you can use CA policies for workload identities to block service principal sign-ins outside trusted IP addresses.
This section provides detailed information about service principal sign-ins, which are application sign-ins using credentials like certificates or app secrets for authentication.
Similar to the user sign-ins section, this part lets you set parameters to refine your analysis. The available filters include Conditional Access policy, Time range, Service principal ID, Resource, and Data view parameters.

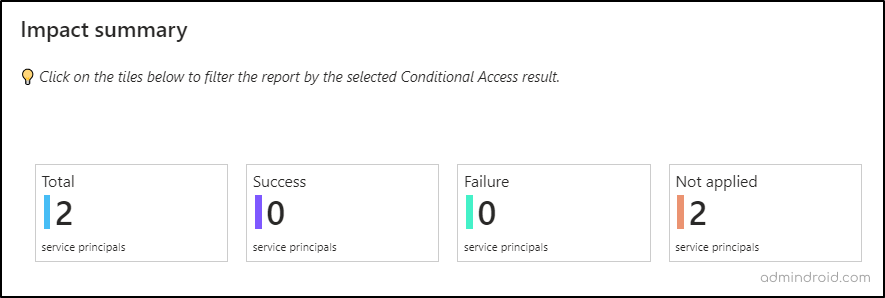
1. Summary of Conditional Access Impacts on Service Principal Sign-ins
In this section, you’ll find four tiles that provide an overview of service principal sign-ins impacted by the selected Conditional Access policies:
- Total: Displays the total number of sign-ins affected by at least one of the selected policies.
- Success: Shows the count of service principals sign-ins that successfully met all required grants and controls.
- Failure: Indicates the number of sign-ins denied access due to unmet assignments and conditions.
- Not applied: Lists the number of service principals that bypassed the selected CA policies because their sign-ins did not match any of the assignments or conditions.
2. In-Depth Analysis of Service Principal Sign-ins in Microsoft 365
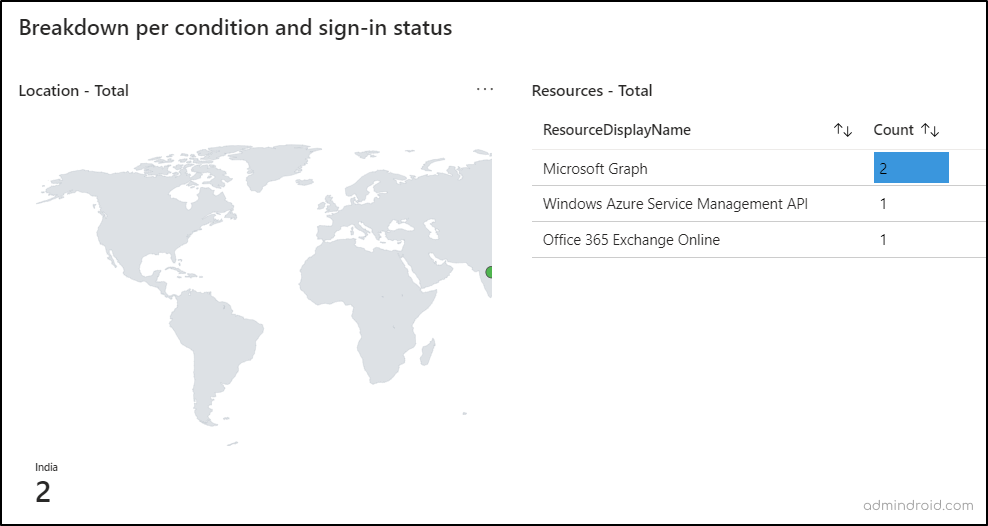
In this section, you can thoroughly examine the breakdown details of service principal sign-ins based on the selected policy. For instance, by choosing the “Success” tile in the above section, you can ensure that the conditions configured in the selected Conditional Access policies functioned as intended. Here’s what you can glean:
- Resources Accessed: Understand which resources users accessed after successfully meeting the Conditional Access requirements. This insight helps validate that the configured policies appropriately govern access to specific resources.
- Location of Sign-ins: Identify the geographic locations from which users signed in to Microsoft 365 resources after complying with the Conditional Access policies. This analysis allows you to verify that configured conditions, such as named locations, are correctly enforced.
By leveraging this detailed analysis, you can confidently assess whether your configured conditions, such as named locations and applications, are effectively working as expected within your Conditional Access policies.
3. Investigate Conditional Access Policies for Workload Identities
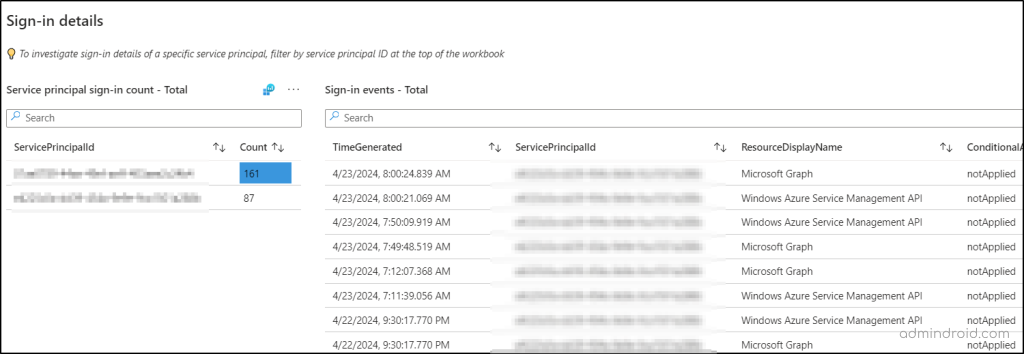
This section auto-populates with service principal sign-in details based on the summary tile you select. You’ll see the sign-in report with the service principal’s ID and their sign-in counts that have either:
- Successfully passed the selected Conditional Access policies.
- Failed to meet the conditions of the configured CA policy.
- were unaffected by the selected policies.
When you click on a specific service principal or sign-in status, you’ll get detailed information displayed in the parallel section. This includes:
- Sign-in time.
- Resource display name.
- Correlation ID.
- Applications.
Create or Edit New Workbook in Microsoft Entra ID
Suppose the pre-built workbook does not cover the Conditional Access insights you need. No issues! You can edit the workbook using the “Edit” option.
Adding cherry on the top, Microsoft allows you to create your personalized workbook in Entra ID. To do it, the Entra Workbook feature gives you five main components text, links, parameters, groups, and query. You can use it to add a description or guidelines, provide jump links, group similar insights, and query any data sources.
Easily Do Conditional Access Assessment with Workbook!
So, that’s it! We have assessed all the sections of the Conditional Access policy insights and reporting workbook in depth. So, why wait? Configure a Conditional Access policy in report-only mode, gain insights about the impacts, and enable it with confidence. I hope this blog will be useful to monitor Conditional Access policy easily. Furthermore, if you have queries, please contact us in the comment section for further assistance.
