Navigating your organization’s structure can be a challenge❌, especially when you need to quickly identify reporting lines or collaborate across teams. Luckily, organization charts in Microsoft 365 make it easy to view your company’s structure and improve collaboration⚡. Whether you’re a new hire or a team lead, knowing who to turn to for what can save you a lot of time.
In this blog, we’ll explore organizational charts—an often-underutilized feature—and show you how to make the most of them. From understanding their purpose to uncovering their perks and practical uses, we’ll cover everything you need to streamline team management.
What is an Organizational Chart in Microsoft 365?
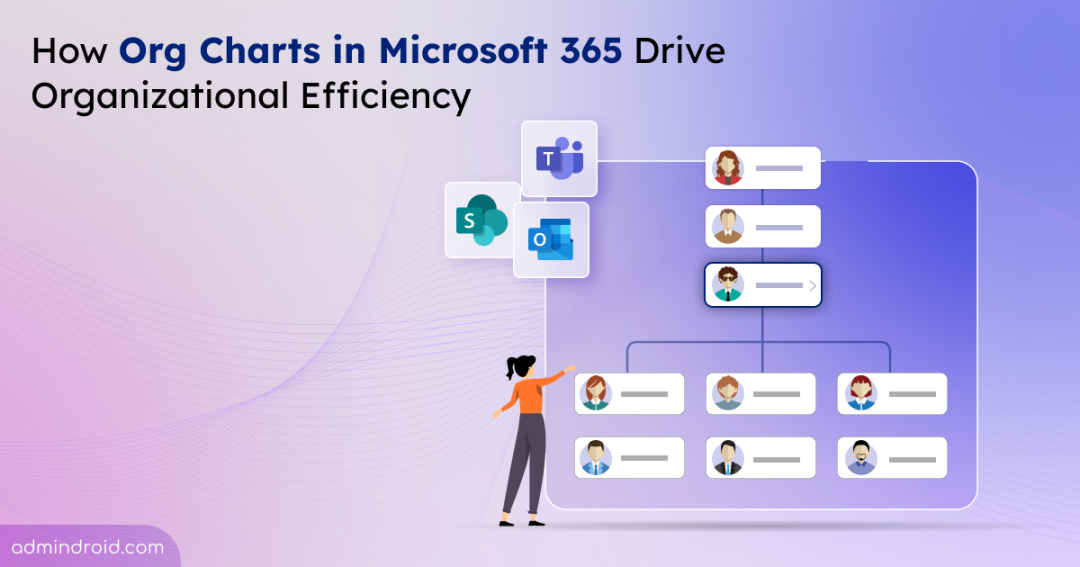
An organizational chart (also called an org chart) is a visual representation of the hierarchy within your company. It illustrates relationships between employees, shows who reports to whom (direct reports), and clarifies roles and responsibilities. By displaying this structure in a clear, easy-to-understand diagram, it becomes much easier for employees and stakeholders to navigate the organization’s layout and understand who is in charge of what.
In Microsoft 365, you can view org charts directly from the persona card in SharePoint Online, Teams, and Outlook. However, for the org chart to display correctly across these apps, the ‘Manager’ attribute must be assigned in Entra ID. Without it, the org chart won’t populate automatically.
Once the manager is assigned, the system will dynamically generate the org chart based on these reporting relationships.
Understanding Organizational Charts in Microsoft 365
Here’s how the full hierarchy appears across Microsoft 365, displaying the user’s team members, roles, and reporting relationships.
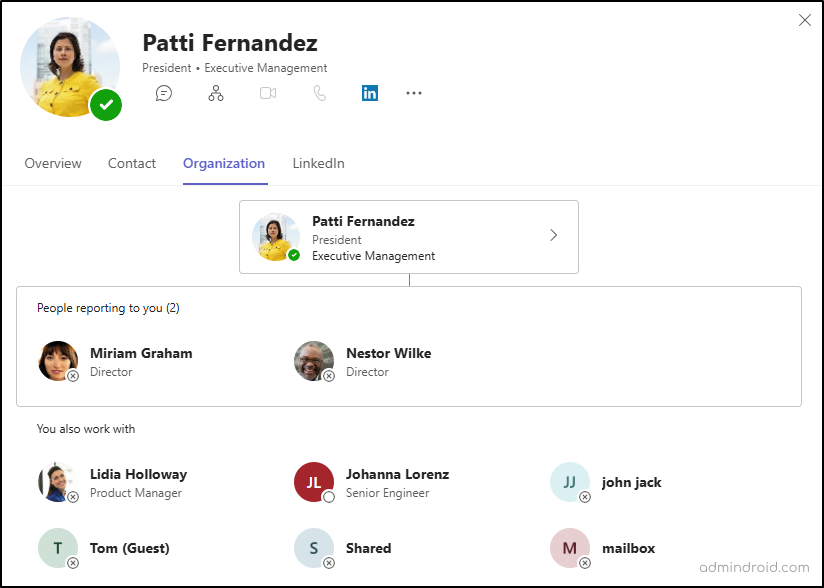
When you open your own org chart, it appears as shown in Figure 1. You’ll notice a single person managing multiple reporters.
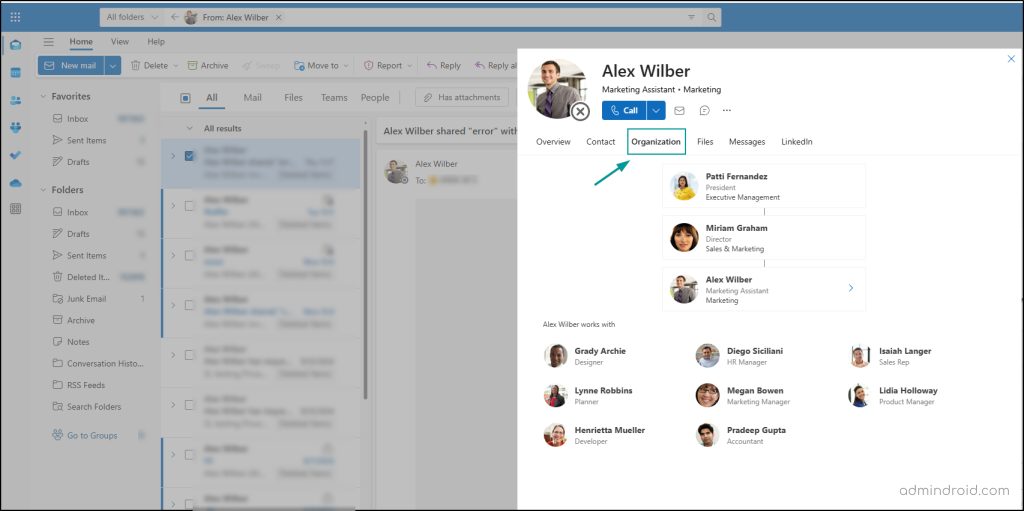
Viewing someone else’s org chart will look like the structure shown in Figure 2.
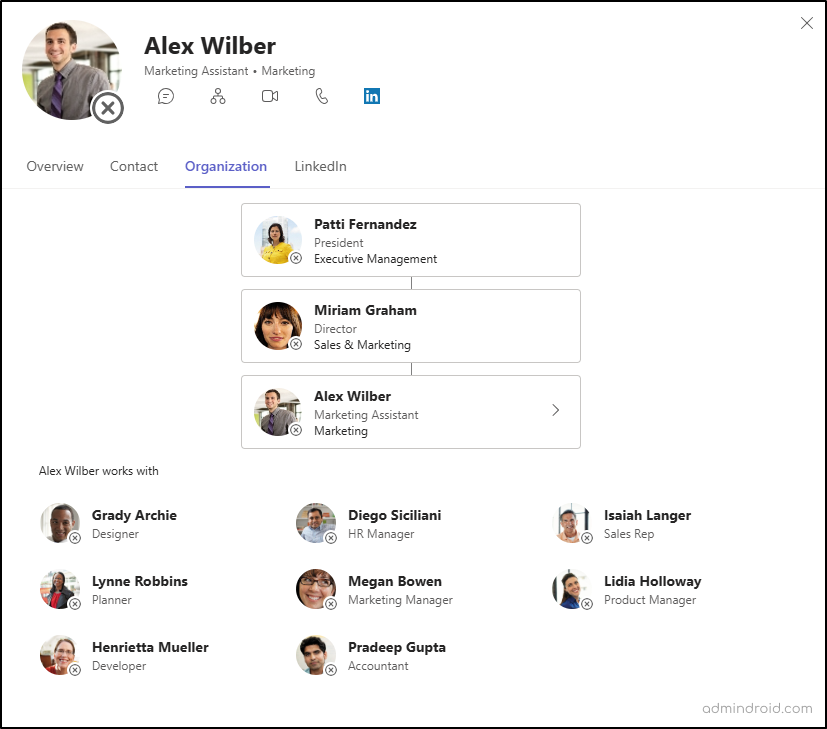
The “Works With” section provides additional insights by analyzing public collaboration data, such as shared meetings, email exchanges, and teamwork patterns. These insights are powered by the People API, ensuring they remain accurate and current.
Purpose of an Organization Chart in the Workplace
The benefits of using an org chart in Microsoft 365 are immense and extend far beyond just visualizing the company structure. Here are a few of the many advantages that an organizational chart in Microsoft 365 can provide for both admins & end users:
📌 Understand the Organization’s Structure
- End Users: The org chart provides a clear view of the company’s structure, showing how teams and departments are organized, as well as the leadership hierarchy. This helps employees understand the organization’s framework and how different parts are connected.
- Admins: Admins can use this chart to keep the hierarchy updated with current leadership and reporting relationships.
💼 View Reporting Relationships
- End Users: The org chart clearly displays reporting lines within the organization. For example, it shows that (Fig 2) Alex Wilber reports to Miriam Graham, the Director of Sales & Marketing, making it easy to identify who to approach for specific issues or approvals.
- Admins: Admins can review the reporting structure to align it with organizational goals and streamline decisions.
👨⚖️ Clarify Roles and Positions
- End Users: The org chart provides a clear view of where employees fit within the organization, helping to define roles and responsibilities. For example, Alex Wilber’s role as Marketing Assistant or Megan Bowen as Marketing Manager is clearly indicated (Fig 2), making it easier to understand how various roles contribute to the organization.
- Admins: Admins can use the org chart to define roles, align them with company goals, and evaluate their distribution across teams. By assigning roles to users in Microsoft 365, admins ensure that team members have the permissions they need to access resources and collaborate effectively. This practice supports streamlined workflows and boosts team performance.
✅ Know Key Collaborators
- End Users: The org chart highlights key collaborators within the team. For example, Alex Wilber works with Grady Archie and Lynne Robbins (Fig 2). Knowing these connections helps strengthen teamwork.
- Admins: Admins can use the org chart to evaluate teamwork and improve cross-department collaboration.
Additional Benefits of Using Org Charts
Helps New Employees Settle In: An org chart gives new hires a clear understanding of the company structure, showing who they will work with and helping them integrate more effectively into their teams.
Better Workforce Planning and Restructuring: For growing businesses or startups, restructuring is inevitable. Org charts make it easier to identify where employees should be moved to optimize team performance. This restructuring ensures that every team is balanced and well-equipped for success.
Supports Long-Term Planning: Org charts can help you identify potential bottlenecks in the organization. If an individual or team is overburdened with many direct reports under them, it becomes easy to spot and make adjustments. This foresight is valuable for contingency planning and business continuity.
Promote Organizational Transparency: By making roles and reporting structures clear, org charts promote a culture of transparency, helping employees understand how decisions are made.
How to View an Organization Chart in Microsoft 365?
Here’s how you can access the org charts across Microsoft 365.
1. Organization Tab in Microsoft Teams
In the new Microsoft Teams, you can easily view a user’s organization hierarchy by hovering over their profile icon anywhere in Teams. This opens their persona card, where you can click the org chart icon to access the chart.
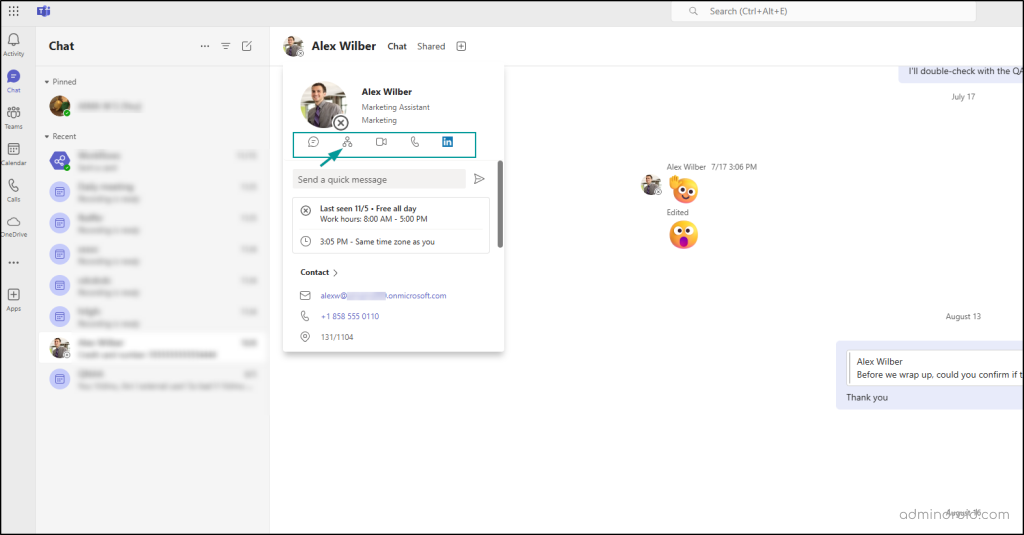
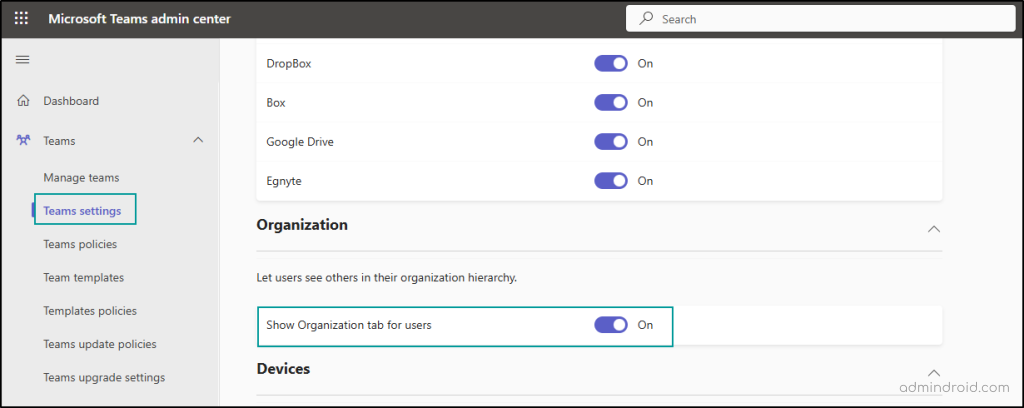
As an admin, you can control the visibility of this feature in Teams by navigating to the Teams Admin Center > Teams > Teams Settings, and under “Let users see others in their organization hierarchy,” toggle the “Show Organization tab for users” option on or off.
2. Organization Chart in SharePoint Online
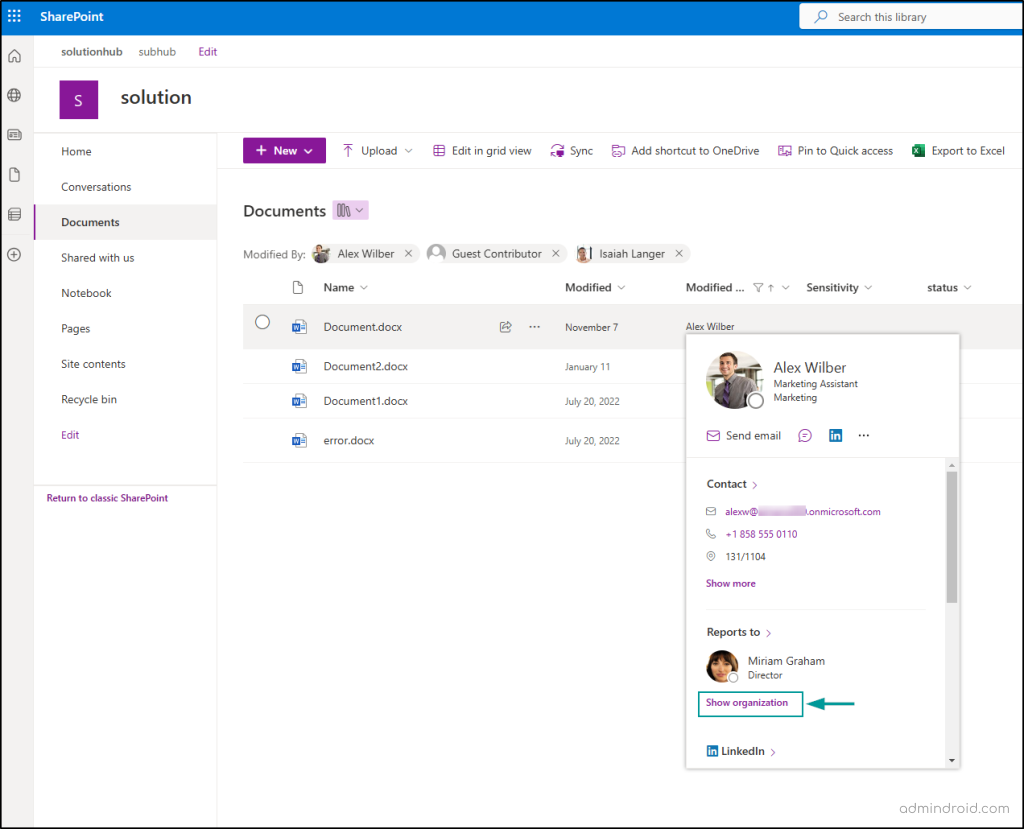
Similarly, in SharePoint, you can view the organization chart by hovering over the user’s name. In the card that opens, click “Show Organization.”
3. Organization Chart in Outlook
To view the organizational chart in Outlook:
- In the search bar at the top of the Outlook window, enter the name of the user whose org chart you want to view.
- Click on their name from the search results.
- Click on the user’s profile icon to open their profile card. Then, navigate to the Organization tab to see their position within the company hierarchy.
New Org Explorer in Outlook:
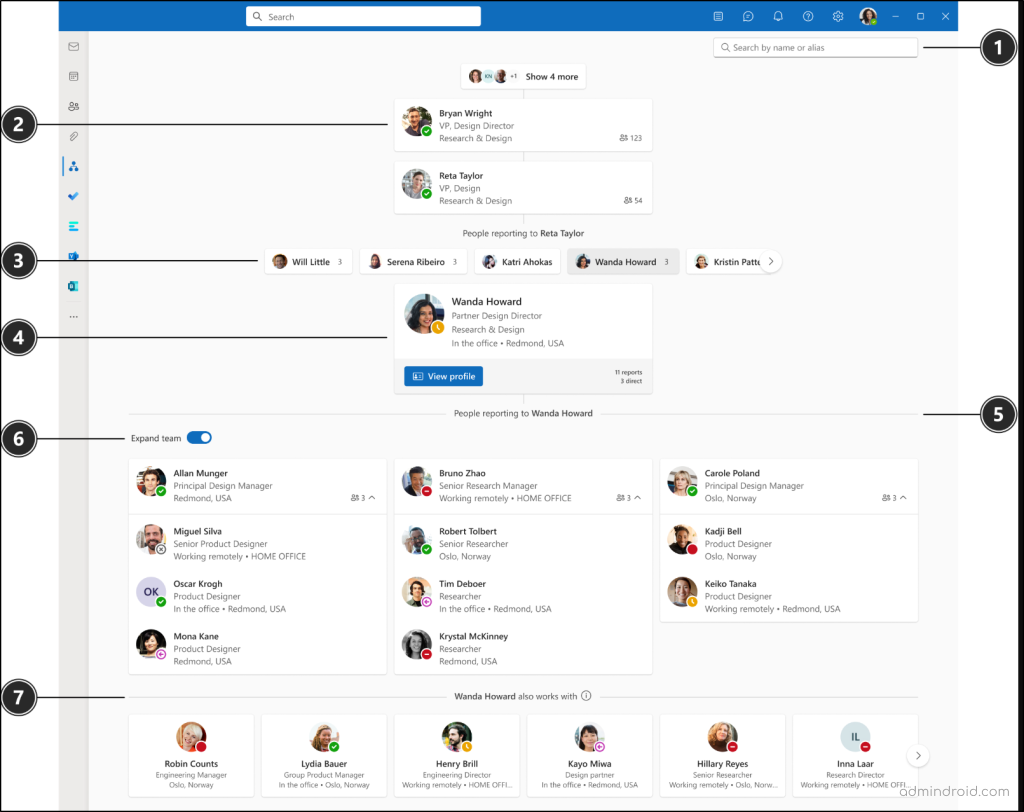
Microsoft has recently announced an advanced version of the org chart feature for Outlook, called Org Explorer. This new service provides a more interactive and comprehensive way to visualize your organization’s structure, teams, and individual roles.
Org Explorer goes beyond the basic org chart, providing a deeper view of your company’s internal structure, team dynamics, and key people across the organization.
Rollout:
The new Org Explorer feature will begin rolling out globally for all Outlook for Windows, Outlook for Web, and Outlook for Mac in late February 2025, with full availability expected by late mid-April 2025.
4. Org Chart in Delve
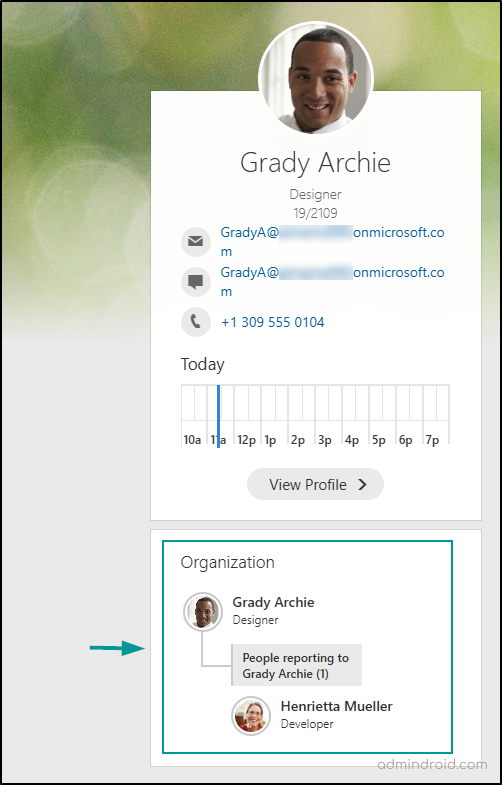
Delve offers a simple way to view the org chart by clicking on a profile icon. It provides a visual representation of the organizational structure, based on data from Azure Active Directory.
Possible Ways to Create an Organization Chart in Microsoft 365
While Microsoft 365 offers several ways to view an organization’s structure, it also provides multiple options to create interactive org charts from user profiles. Here are the different ways to make an org chart in Microsoft 365:
1. Create an Organization Chart in Microsoft Visio
With Visio, you can create and view org charts either from scratch or by importing data from sources like Microsoft 365 or Excel. This allows you to design a detailed, customized org chart for your organization. You can also export the org chart to Excel in Visio.
2. Create an Org Chart with Power Apps
Power Apps allows you to build and view org charts by connecting to data sources such as Office 365 users. You can create a dynamic, custom org chart tailored to your organization’s structure.
3. Make an Org Chart in Excel
Though not an automated solution, Excel can be used to create a custom org chart manually by importing data such as employee names, roles, and reporting lines. With Excel’s SmartArt feature, you can design basic charts. This method is suitable for small teams or those who require complete customization.
4. How to Create an Organization Chart in Microsoft Word?
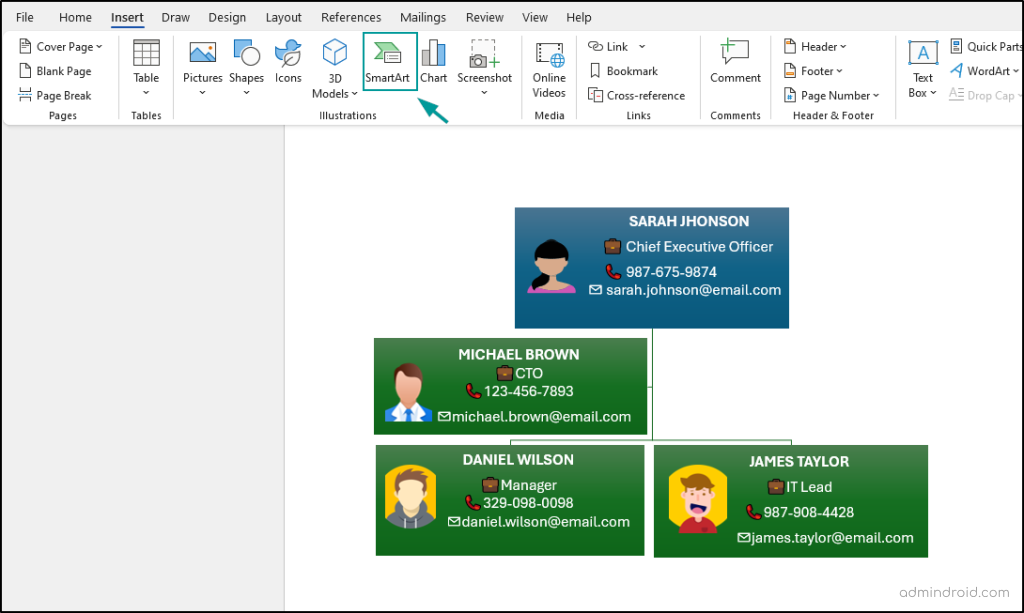
Creating an organizational chart in Microsoft Word is simple using the SmartArt feature. To make an organization chart in Microsoft Word, follow the steps below.
- Open Microsoft Word and create a new document.
- Go to the Insert tab and click on SmartArt in the illustrations group.
- In the SmartArt Graphic dialog box, select Hierarchy from the left menu and choose a layout like Organization Chart -> OK.
- Click on the text boxes in the chart to add names, titles, or other information.
- Customize the chart using the SmartArt Design tab to change layout, style, or colors, and the Format tab to adjust text or shapes.
- Resize and reposition the chart as needed by dragging the corners or moving it to your desired position.
- Save your document.
You can also use PowerPoint to create similar charts. Additionally, you can extract the organization hierarchy data to Excel or text files for further analysis.
Common Queries About Organizational Charts in Microsoft 365
Here are a few common questions regarding missing org charts and how to address them:
1. Why is my Teams not showing Organization option?
In classic Teams, the Organization tab is only available in 1:1 chat. However, in new Teams, you can access the org chart directly from anywhere in Teams by clicking on the profile card of a user.
If you still can’t see the Organization tab:
- Ensure the reporting structure is configured in Azure AD.
- Check with your admin to verify if the feature is enabled for your tenant.
2. How to update the Organizational Chart?
The data in Microsoft 365’s organizational chart is based on Azure AD. Update the “Manager” field for employees in Azure AD to keep the chart accurate. This ensures the hierarchy and reporting structure are automatically reflected.
3. Can I view the full hierarchy of the organization?
No, the org chart typically shows only the direct reports or managers of a user, not the entire company structure. This limited view is designed to streamline the information and focus on relevant relationships.
4. Why doesn’t my org chart show certain roles or employees?
If certain roles or employees are missing, it could be due to incomplete data in Entra ID. Make sure that the required employee data is available in the system, and check the visibility settings for the org chart feature.
Limitations of Organizational Chart in Microsoft 365
While the Organizational Chart feature in Microsoft 365 provides a convenient way to visualize reporting relationships and team structures, here are some limitations to consider:
- The organizational chart only supports user properties from Entra ID (formerly Azure Active Directory), limiting the information displayed to those available in the directory.
- There are no options to customize the profile cards in the org chart.
- The org chart feature is not available in all Microsoft 365 plans and might require higher-tier subscriptions for access.
- The search function within the organizational chart may not be as robust as some users would prefer, limiting quick access to specific individuals or teams.
- You are unable to view the complete organization’s hierarchy. The chart typically displays a limited scope, such as the user’s direct reports or managers, rather than the full organizational structure.
We hope this comprehensive guide on Office 365 organization charts blog has provided you with a helpful overview of the importance of org chart in Microsoft 365. Thank you for reading! If you have any questions, feel free to leave them in the comments section below.
