Today’s workforce is no longer tied to an office, users connect from home, airports, or even a coffee shop down the street. This flexibility creates a new challenge: traditional VPNs can’t keep up. Connections lag, performance suffers, and IT has little visibility into the applications employees are actually using. When work happens everywhere, employees naturally turn to whatever tools help them get the job done faster, whether that’s drafting proposals in Gen AI apps or sharing files through unsanctioned SaaS platforms.
This lack of control has created a massive blind spot for security teams. While private app usage can be monitored using the application activity report, tracking how employees use cloud apps has long been a challenge. That changes now.
Microsoft introduces Application Usage Analytics in Global Secure Access. This powerful feature, currently in public preview, gives you a single pane of glass to track private and cloud application usage across the entire organization, no matter where users are working. In this blog, we’ll dive into how it works and why it’s a game-changer for the modern workplace.
What is Global Secure Access in Microsoft Entra?
Global Secure Access (GSA) is a unified Security Service Edge (SSE) solution that combines Microsoft Entra Internet Access and Microsoft Entra Private Access. It provides identity-driven, secure access to both internet and private applications, replacing traditional VPNs with a Zero Trust approach. Built on principles like least privilege, explicit verification, and continuous risk assessment, GSA ensures that users can work securely from anywhere while maintaining a trusted and compliant environment.
Purpose of the Application Usage dashboard
The application analytics dashboard gives you centralized view of how users access both cloud-based and on-premises applications. It provides actionable insights into application usage patterns, risky apps, app categorization, first and last access, traffic details, etc., helps optimizing app usage and improve security posture.
With the ability to view data across different time intervals, such as the last 24 hours or the past week, you can easily spot trends, usage spikes, and anomalies. Using these visual insights, you can instantly detect unapproved applications, identify underutilized or redundant applications, monitor license usage, and track employee adoption of new tools.
How to View Application Usage Analytics in Microsoft Entra (preview)
Prerequisites to access application insights:
Roles: Global Administrator, Security Administrator, Security Reader, or Reports Reader.
Licenses: A Microsoft Entra ID Premium license (P1 or P2), or equivalent licensing such as Microsoft 365 E3/E5.
To access this Insights and Analytics dashboard, follow the steps below.
- Sign in to the Microsoft Entra admin center.
- Go to Global Secure Access in the left navigation pane.
- Select Applications and click Insights & Analytics.
Getting Started with the Application Insights & Analytics Dashboard
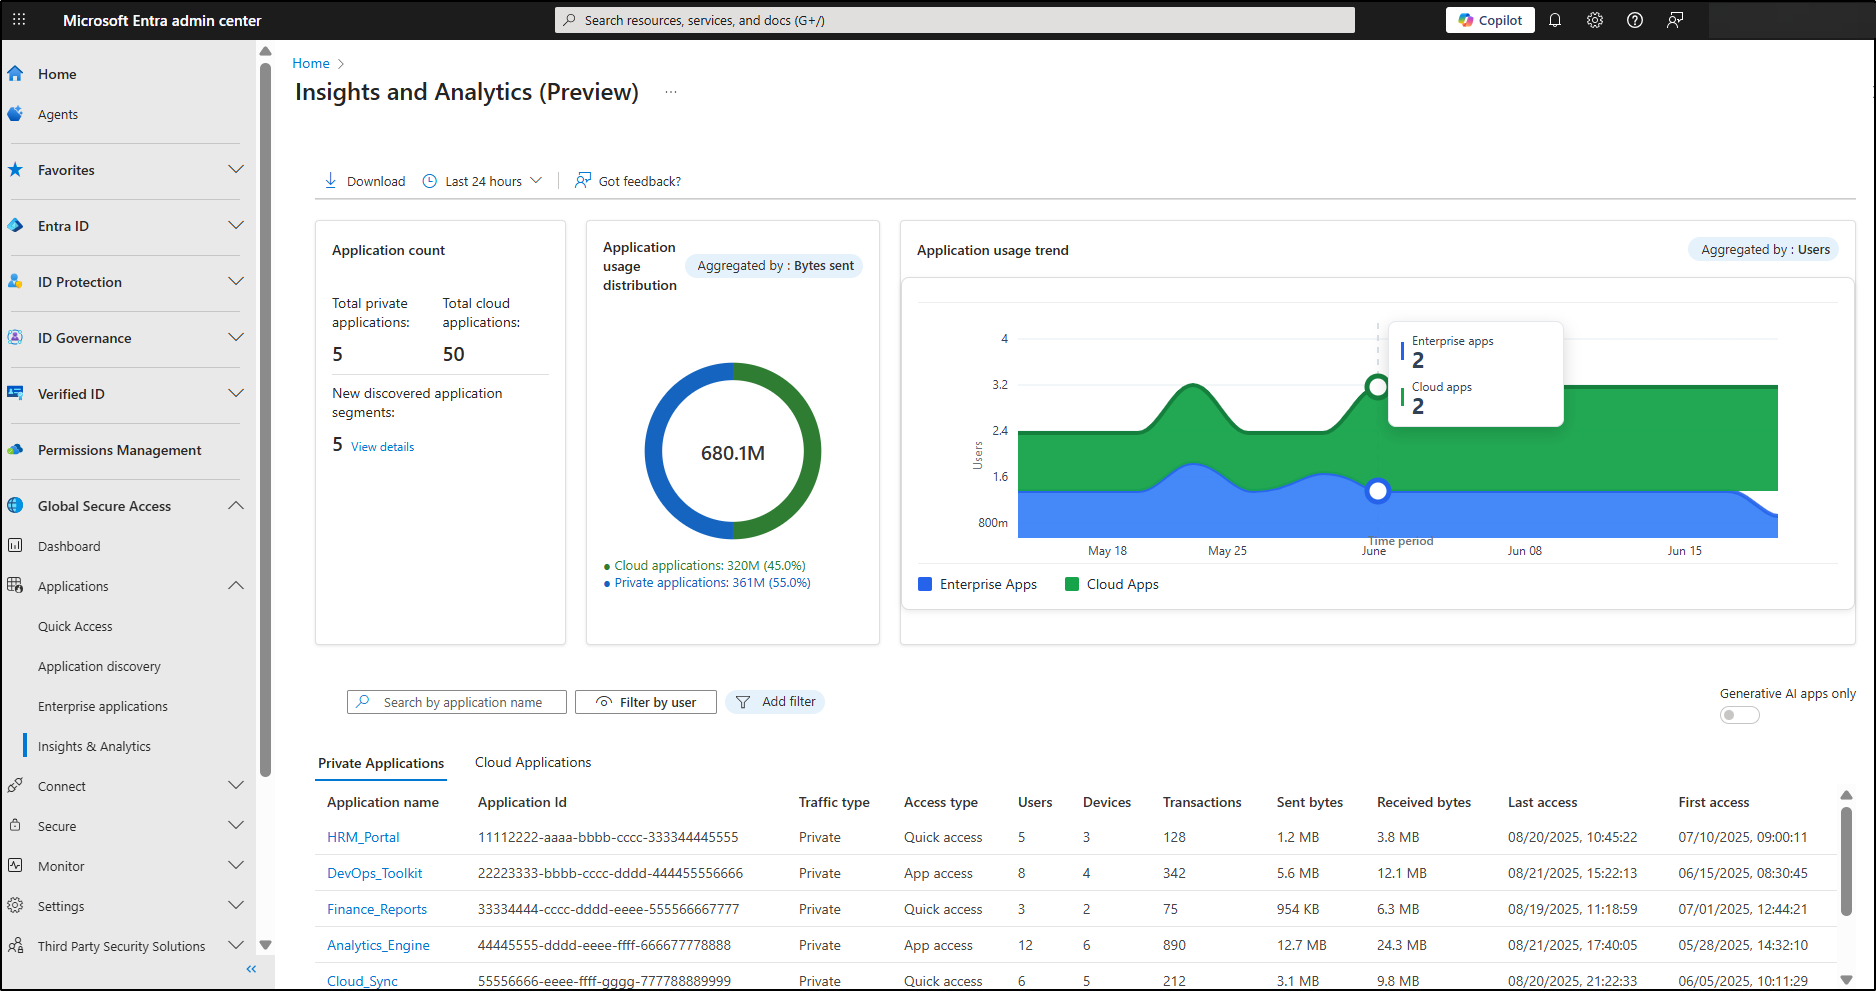
The Insights and Analytics dashboard in Microsoft Entra highlights three key widgets that give you a clear visibility into application usage patterns.
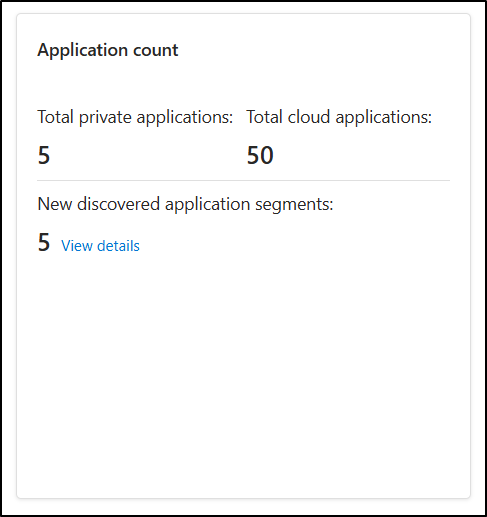
- Application Count: This panel shows the total number of private and cloud applications accessed by users and devices within the selected timeframe. A key feature here is the count of New discovered application segments, which highlights all apps that have been accessed for the very first time in your tenant. These details give you a clear snapshot of your organization’s app usage landscape, helping you understand the growing use of cloud applications across your environment and assess potential risks.
Note: To dig deeper about newly discovered segments, click ‘View details’ to open the Application Discovery page.
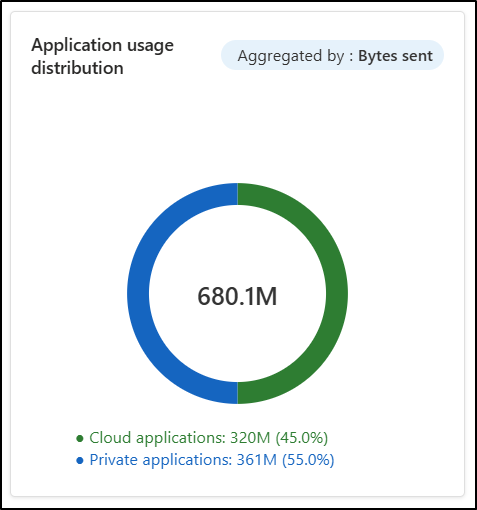
- Usage Distribution: This widget presents a visual overview of application usage as a pie chart, categorizing usage by type, including cloud and private applications. You can view data based on metrics such as transactions, bytes sent, bytes received, etc., and identify which application categories dominate traffic at a glance.
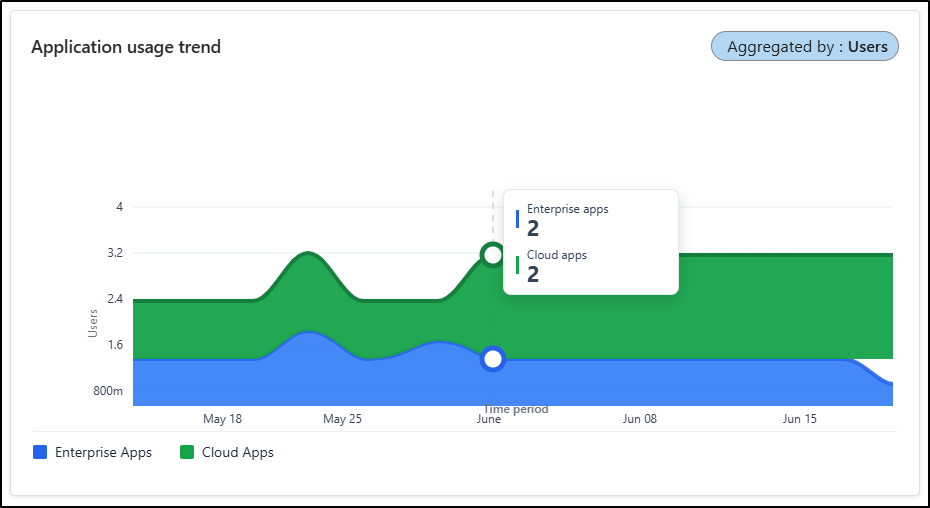
- Application Usage Trends: This dashboard element shows how application usage evolves over a selected time period. It highlights peaks, patterns, and shifts in usage for both cloud and private applications. You can interact with the graph to explore and understand app usage during specific times within the selected period. You can group trends by metrics such as transactions, users, devices, bytes sent, or bytes received, enabling you to monitor changes, detect emerging patterns, and analyse app usage over time.
Key Components in the Insights and Analytics Dashboard
The insights and analytics dashboard categorize applications into two primary types: private and cloud applications. Each offers distinct analytics to monitor and manage their utilization effectively. The dashboard provides detailed, per-app insights, allowing you to see exactly which individual apps are being accessed, by whom, and how often. This granular visibility helps you monitor usage patterns, enforce access controls, and proactively manage security and compliance.
Private Application Analytics
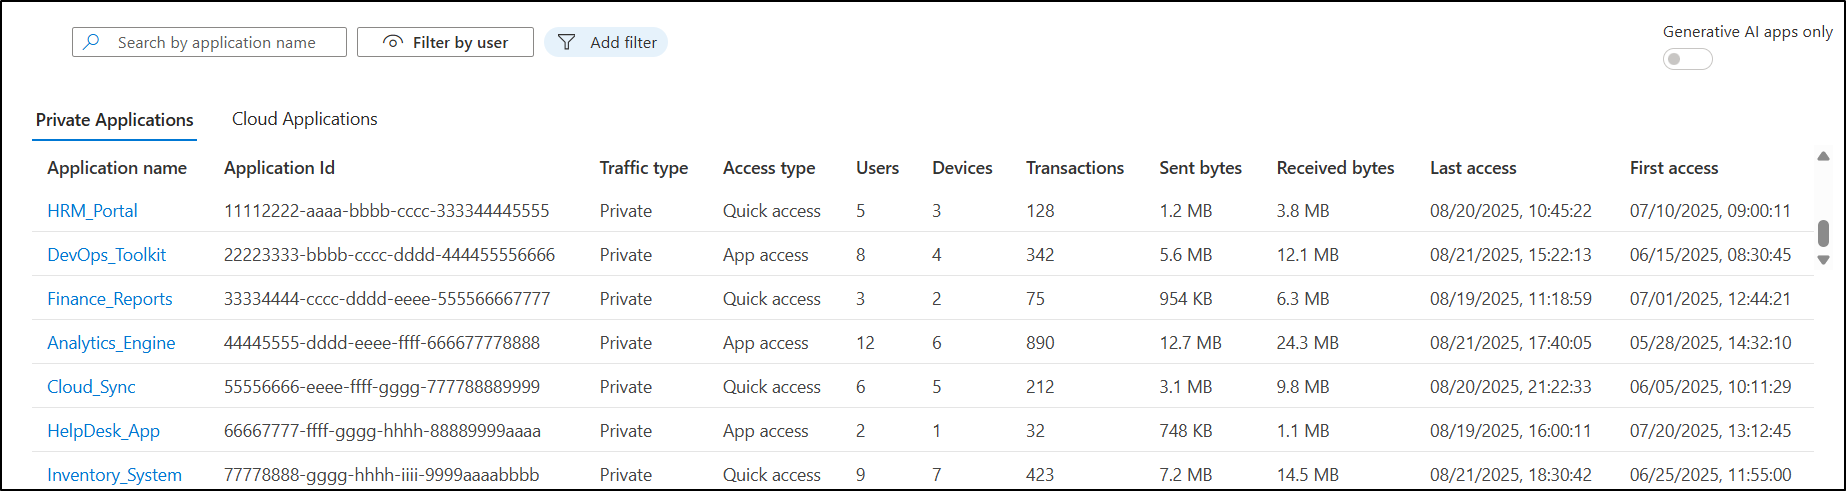
The Private Application Analytics is a dedicated hub for understanding how users access enterprise applications created and managed within your organization. Going beyond high-level usage trends, it drills down to the specifics, offering a clear picture of each application’s usage with critical details such as traffic type, transactions, and more.
This feature transforms app monitoring from a simple summary into a powerful diagnostic tool, empowering you to manage your application landscape more efficiently. You can easily identify and remove underutilized applications, review the most-used apps, ensure secure access, spot unusual activity, and address potential security threats. By turning internal app monitoring into a seamless process, it helps you make smarter, data-driven decisions.
Application Details: View information such as application name, ID, traffic type, access type, number of users, devices, transactions, bytes sent/received, and first/last access dates.
Cloud Application Analytics
Unlike private applications, which can be restricted easily, controlling access to cloud applications across different networks is much more challenging. Therefore, monitoring cloud application usage in an organization is crucial for admins. Cloud Application Analytics provides you granular insights into all cloud application your organization utilizes, including both internet-based and Microsoft 365 applications.
It reveals how different cloud apps are being used, including traffic, users, and activity levels. This feature aids in identifying generative AI application usage, shadow AI application, high-risk cloud applications, and unsanctioned applications. It results in enabling better control and security of the organization’s cloud footprint.
Application Details: Access information such as application name, category, risk score, number of users, transactions, bytes sent and received, and user access patterns.
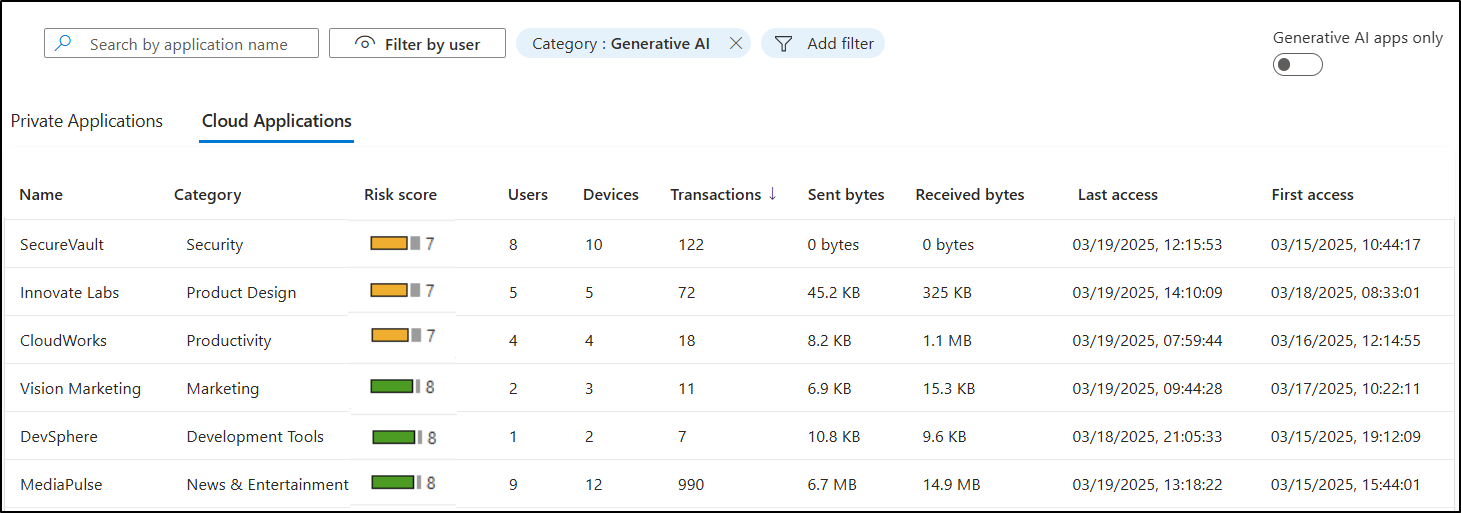
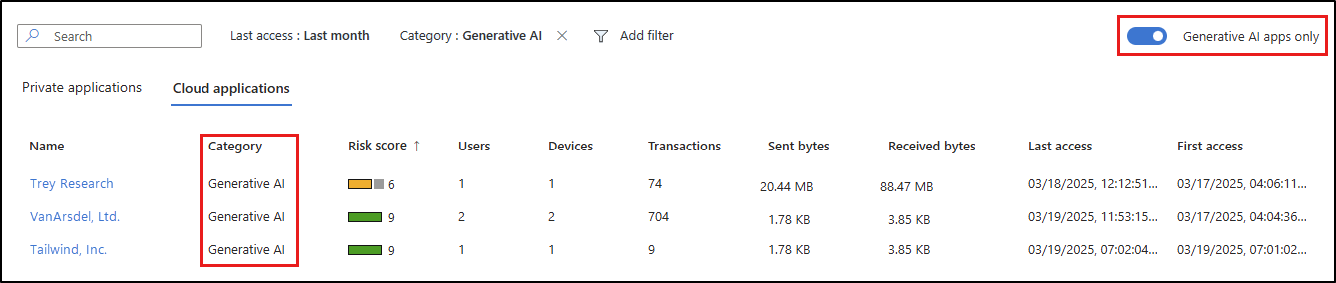
Note: You can use the “Generative AI apps only” toggle to identify AI apps accessed by users across Microsoft 365.
Key Capabilities:
Click on any individual private or cloud app to open a detailed insights panel, organized into two tabs with app-specific information.
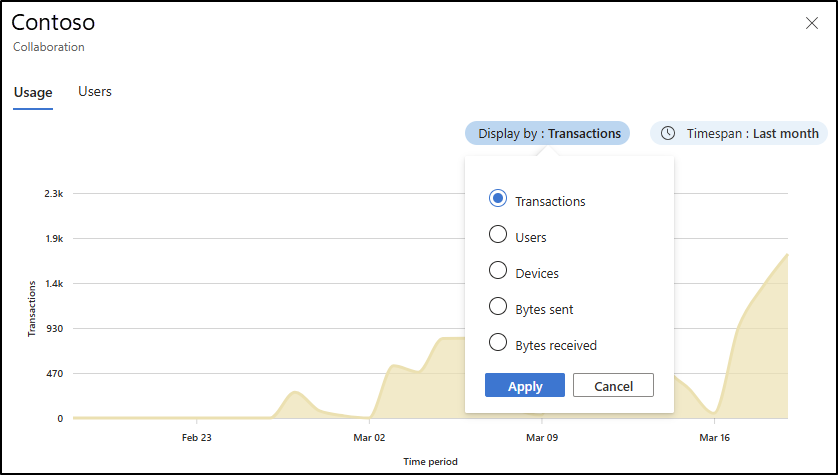
Usage Tab
- Displays a graph illustrating usage metrics, including the number of transactions, traffic volume, user engagement, etc., over the past 30 days or a custom time interval.
- Offers a visual representation of application usage trends, helping you identify peak usage times and potential performance bottlenecks instantly.
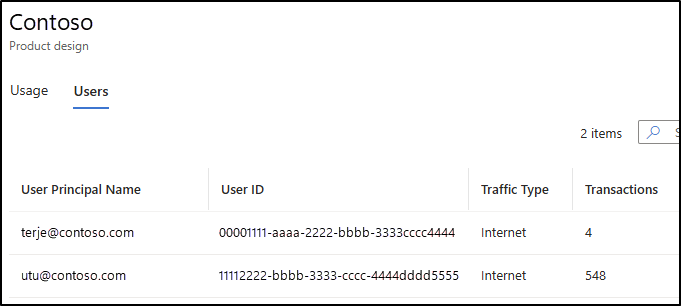
Users Tab
- The Users tab offers a breakdown of all users accessing the application. It provides statistics on which users are accessing the application, the number of transactions associated with each user, their traffic types, and more.
- It allows for a granular analysis of user behaviour and helps you identify any unauthorized access or anomalies.
Best Practices for Optimizing Application Usage Insights
- Utilize web content filtering for risky sites
Use web content filtering to block malicious or unnecessary domains and websites. It helps to stop unapproved apps from being used in your organization
- Regularly audit AI tool usage
Periodically review which users are accessing generative AI tools using cloud app categorization filters. This ensures that access aligns with current business needs and security policies.
- Monitor usage trends for anomalies
Track application usage patterns over time to detect unusual spikes or drops in activity. That patterns could indicate security issues or underutilized resources.
- Implement just-in-time access policies
Enforce policies that require temporary access for certain applications. This ensures that users have access to apps only when necessary, reducing the window of exposure and minimizing security risks.
- Monitor third-party application security with usage analytics
Use application usage analytics to identify active third-party applications, then follow Microsoft Secure Score recommendations to strengthen application security.
- Remove inactive or redundant applications
Use usage data to identify applications with minimal or no activity and remove unused apps to reduce the attack surface, optimize licenses, and simplify management.
- Regularly monitor high-risk applications
Keep an eye on applications with high-risk scores or unusual usage patterns to proactively manage potential security threats.
That’s a wrap on application usage analytics in Microsoft Entra. We hope this blog helps you understand how to effectively utilize application usage insights. Beyond monitoring apps, it also helps detect the use of generative AI tools. So that, you can identify adoption trends, flag risky usage, and enforce the right access policies. The features are still evolving, and we’ll keep this blog updated as new capabilities roll out. If you have any questions or need guidance, feel free to leave a comment, we’re happy to help!


